Linux "top" command
The "top" command is essential for Linux system administrators, offering real-time monitoring and management of processes and resource usage. It features an interactive interface that provides detailed insights into system performance and allows process termination.
The top command is an invaluable tool for system administrators who need to keep an eye on processes and resource usage in Linux. It’s a staple in the sysadmin toolkit, and you’ll find it pre-installed on virtually every Linux distribution. What makes top so handy is its interactivity; not only can you view and monitor processes, but you can also terminate them if necessary.
Getting Started with Top
To fire up top, simply open your terminal and type top. This launches the interactive interface, which may seem a bit overwhelming at first glance, but it's quite straightforward once you get the hang of it.
Deciphering the Interface
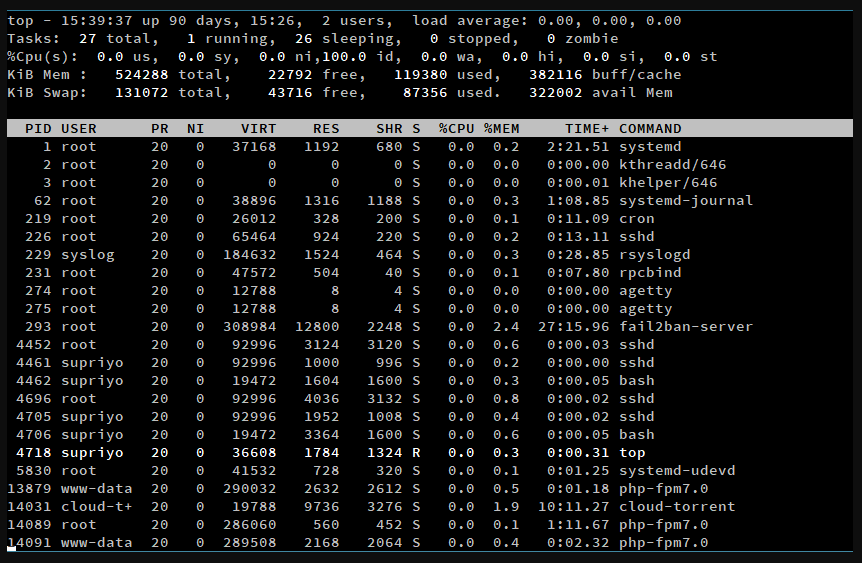
Before diving into the details, you might want to check the version of top you’re using by typing top -v. Once you’re in, the screen is divided into two main sections: the summary area at the top and the task area below, which lists all the processes. By default, this information refreshes every three seconds, providing a near real-time view of your system's performance.
The Summary Area
The first line of the summary area displays the current time, the system uptime, and the number of users currently logged in. It also shows the load averages for the past 1, 5, and 15 minutes, which can help you understand how heavily your system has been used over those time frames.
The second line provides a snapshot of the number of tasks and their states: running, sleeping, stopped, or zombie. This is crucial for understanding how many processes are actively using resources versus those that are idle.
Next, you'll find the CPU usage breakdown:
- us: Time spent on user processes.
- sy: Time spent on system (kernel) processes.
- ni: Time spent on processes with adjusted priority (nice value).
- id: Idle CPU time.
- wa: Time waiting for I/O operations to complete.
- hi: Time handling hardware interrupts.
- si: Time handling software interrupts.
- st: Time stolen from this VM by the hypervisor (applicable in virtualised environments).
The fourth line details memory usage, showing total physical memory and how much is free, used, or cached. The fifth line does the same for swap memory, including how much is recoverable from caches.
The Task or Process Area
Below the summary, the task area provides a list of all processes, each with several columns of information:
- PID: Unique Process ID.
- USER: Username of the process owner.
- PR: Priority of the process.
- NI: Nice value, which affects scheduling priority.
- VIRT: Virtual memory used.
- RES: Resident memory used (physical memory).
- SHR: Shared memory used.
- S: Current status of the process.
- %CPU: CPU usage percentage since the last update.
- %MEM: Percentage of physical memory used.
- TIME+: Total CPU time consumed by the process, shown in hundredths of a second.
- COMMAND: The command that started the process.
Process statuses include:
- D: Uninterruptible sleep (usually I/O).
- R: Running or runnable (on run queue).
- S: Sleeping (idle).
- T: Stopped by job control signal.
- Z: Zombie process, terminated but not reaped by its parent.
When you're ready to exit top, just press q. Avoid using Ctrl+x, as this can leave a process in a stopped state.
Looking to enhance your Linux infrastructure? At EssingtonITS.co.uk, we offer expert support and tailored solutions to optimise your systems. Let us help you achieve seamless integration and improved performance.
person people found this useful.