Report Viewer
Report Viewer is a Moodle tool offering pre-built reports on learner activity, course completions, and more, with features like scheduled email delivery and secure view links. It's designed to simplify data access without custom queries.
Report Viewer
Report Viewer is a reporting tool for Moodle that gives administrators and managers access to a library of ready-made reports covering learner activity, course completions, quiz results, enrolment trends, platform growth, and more. Reports are generated automatically in the background and displayed instantly when you open them no waiting for queries to run. They can also be emailed to colleagues and stakeholders on a schedule, with secure view links that work without a Moodle login.
What this product is for
Moodle's built-in reporting gives you basic activity data, but important questions are hard to answer without exporting spreadsheets or writing custom queries. Report Viewer fills that gap with a curated set of pre-built reports that surface the information most organisations need: who is falling behind, which courses have low engagement, where learners are struggling, whether compliance obligations are being met, and how the platform is growing overall.
Rather than giving you a query builder to configure yourself, Report Viewer provides a set of well-designed reports that are ready to use from day one. The library grows over time new reports become available automatically when you update the plugin.
Main features
- A library of thirteen pre-built reports covering completions, compliance, engagement, quiz results, enrolment trends, inactive users, and platform-wide system health
- Reports display key figures at a glance, with interactive charts and sortable data tables
- Reports are always pre-computed they open instantly without slowing down your site
- Scheduled email delivery send any report to Moodle users or external email addresses on a daily, weekly, or monthly schedule
- Secure view links in emails recipients can view the full report in a browser without needing a Moodle account
- PDF download print or save any report as a PDF directly from the browser
- White-label branding add your organisation's logo, colours, and footer text to all reports and emails
- Role-based access control who can view reports, manage schedules, and change settings
How to use it
Finding your reports
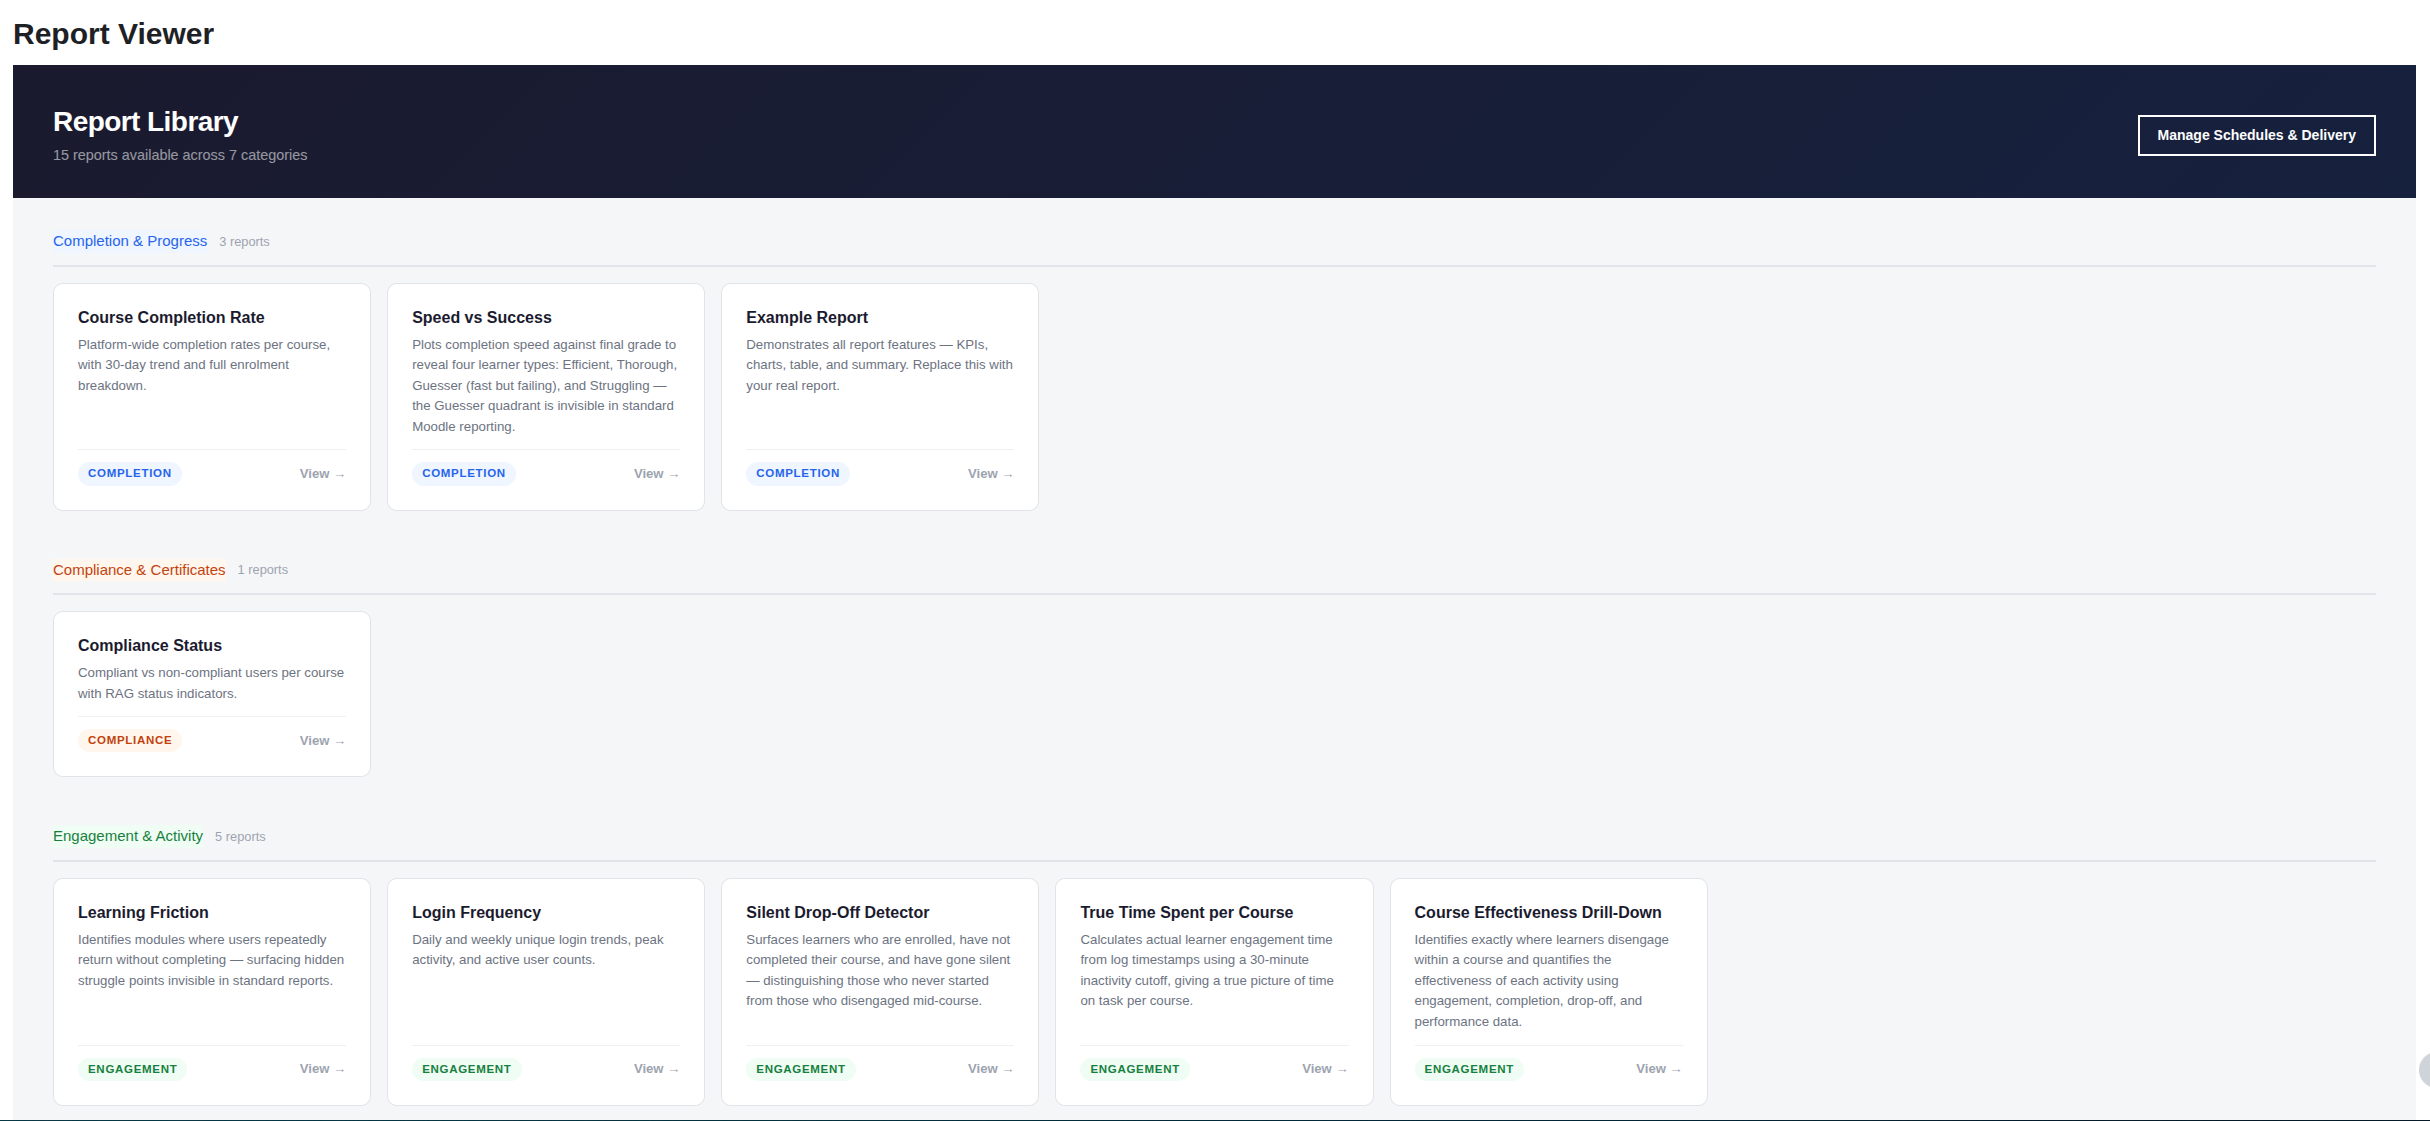
Go to Site administration → Reports → Report Library. You will see a card for each available report, grouped by category. Click any card to open that report.
Reading a report
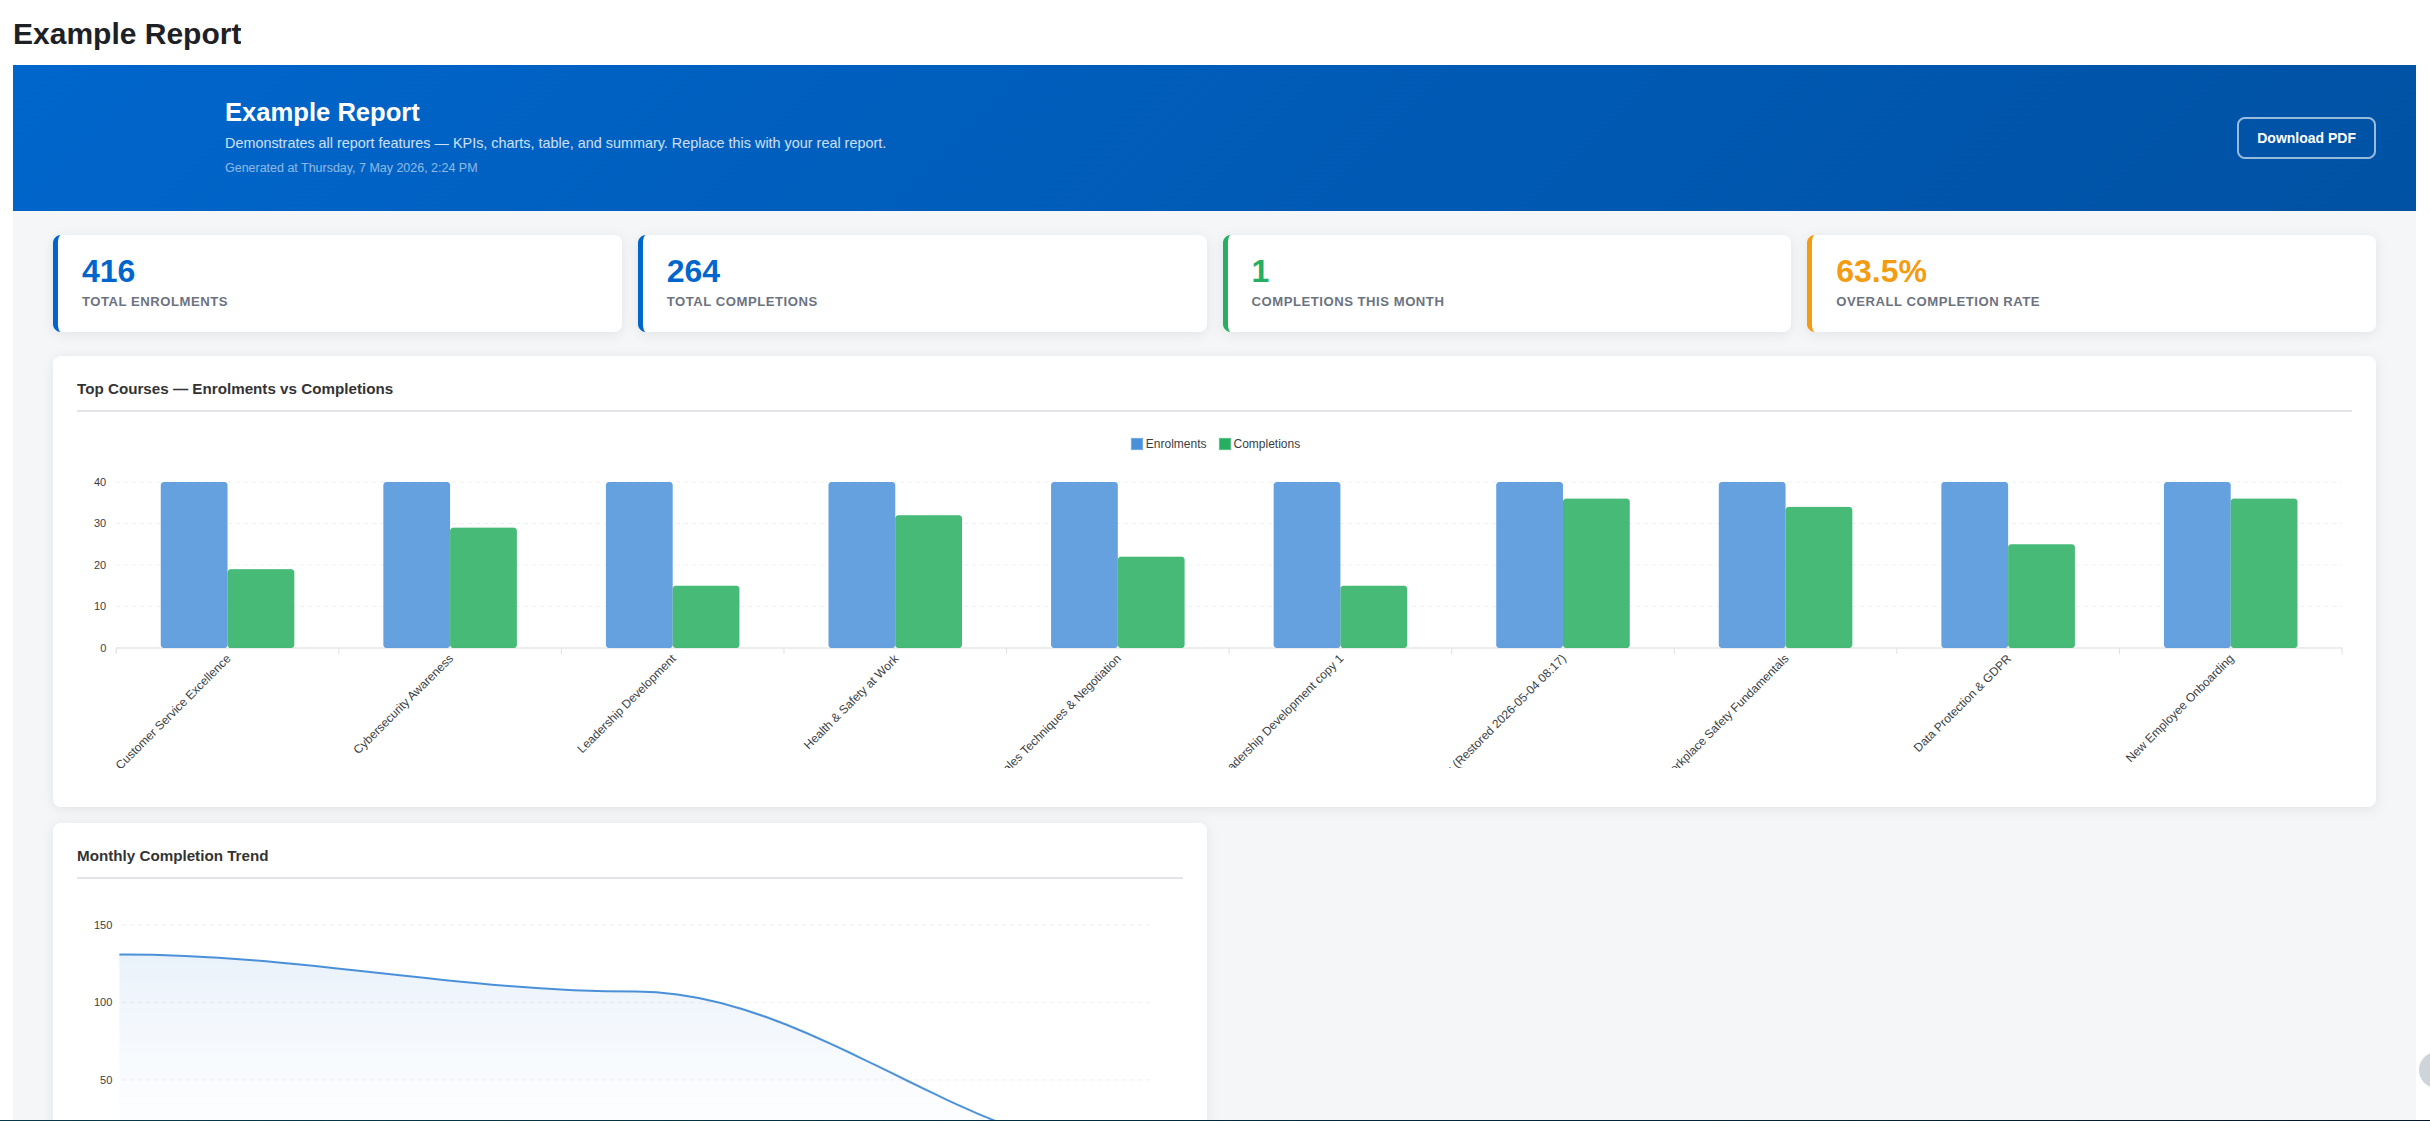
Each report is laid out in the same way:
- Key figures a row of highlighted numbers at the top summarising the most important findings
- Charts visual breakdowns of the data, such as trends over time, comparisons between courses, or distribution of scores
- Data table a detailed, sortable table with the underlying figures
- Summary a short written summary of what the data shows
To save or share the report, click Download PDF. This opens your browser's print dialog, where you can save as PDF or print directly.
Setting up scheduled email delivery
You can arrange for any report to be sent automatically by email.
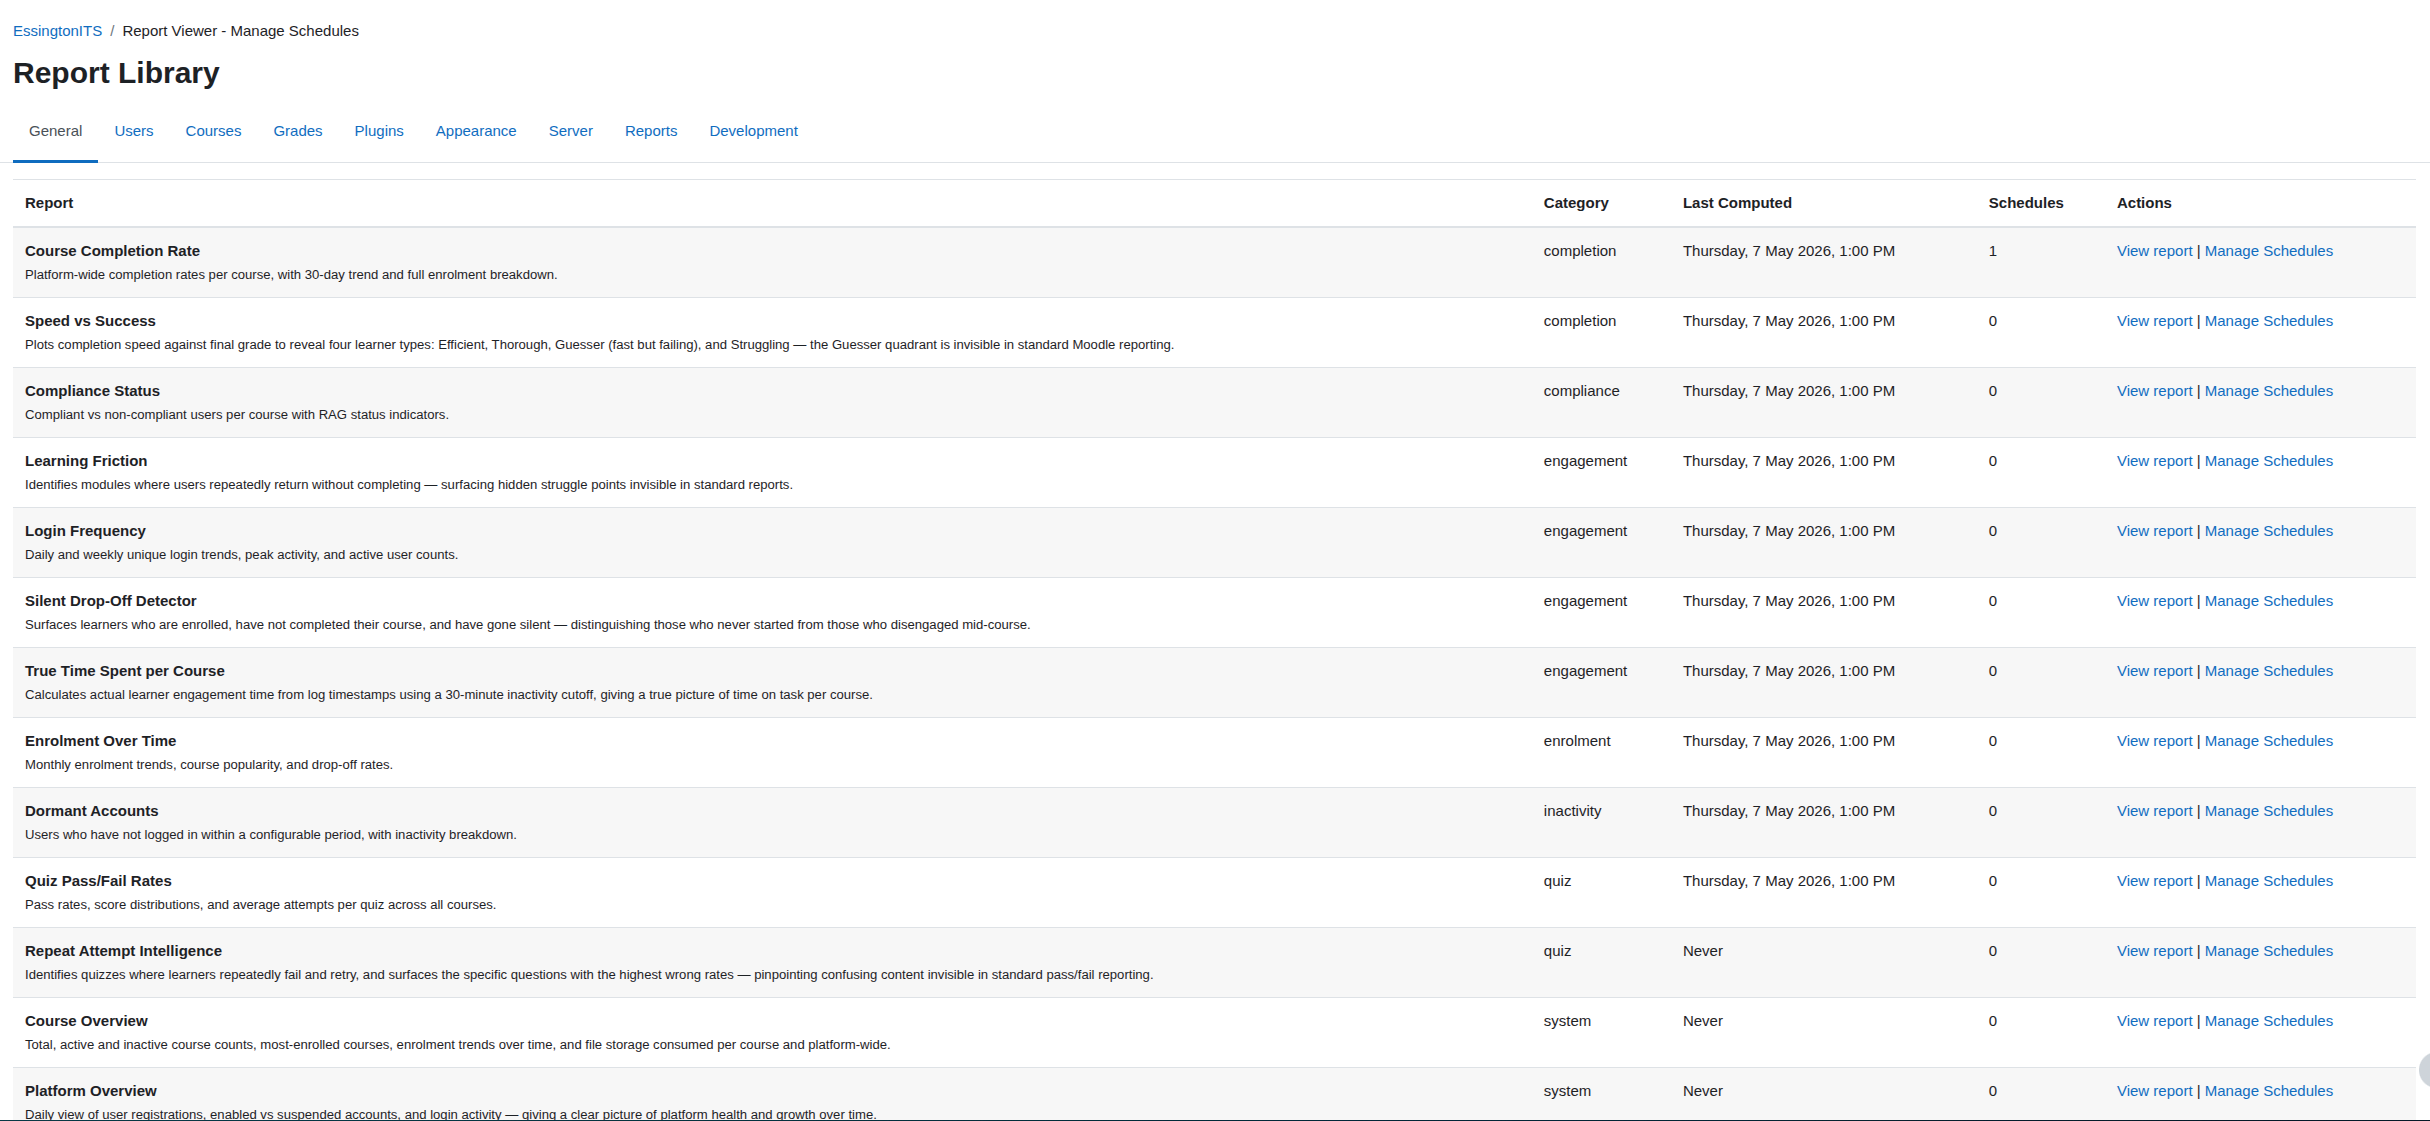
- Go to Site administration → EssingtonITS → Report Viewer - Manage Schedules, or open a report and click Add Schedule.
- Choose the frequency: daily, weekly (pick a day), or monthly (pick a date).
- Set the time you want the email to go out.
- Choose how long the secure view link in the email should remain active (see Link expiry options below).
- Save the schedule, then click Add Recipient to choose who receives it.
Recipients can be Moodle users or any external email address. External recipients do not need a Moodle account.
Link expiry options
| Option | What it means |
|---|---|
| Expires when next delivery runs | The link from the previous send stops working as soon as the next email goes out. |
| Expires after N days | The link works for a set number of days from when it was sent. |
| Never expires | The link stays active indefinitely. Use with caution for sensitive data. |
| Manual revoke only | The link remains active until an administrator revokes it. |
Configuring branding
Go to Site administration → EssingtonITS → Report Viewer - Settings. Here you can:
- Upload your organisation's logo (PNG, JPG, or SVG)
- Set primary and secondary colours
- Choose a font (Inter, Roboto, Open Sans, or system default)
- Add a tagline that appears in the report header
- Add footer text, such as a disclaimer or contact details
- Set the sender name and subject line format for scheduled emails
Branding applies to all reports, PDFs, and scheduled emails.
Common tasks
Check who has not completed a course
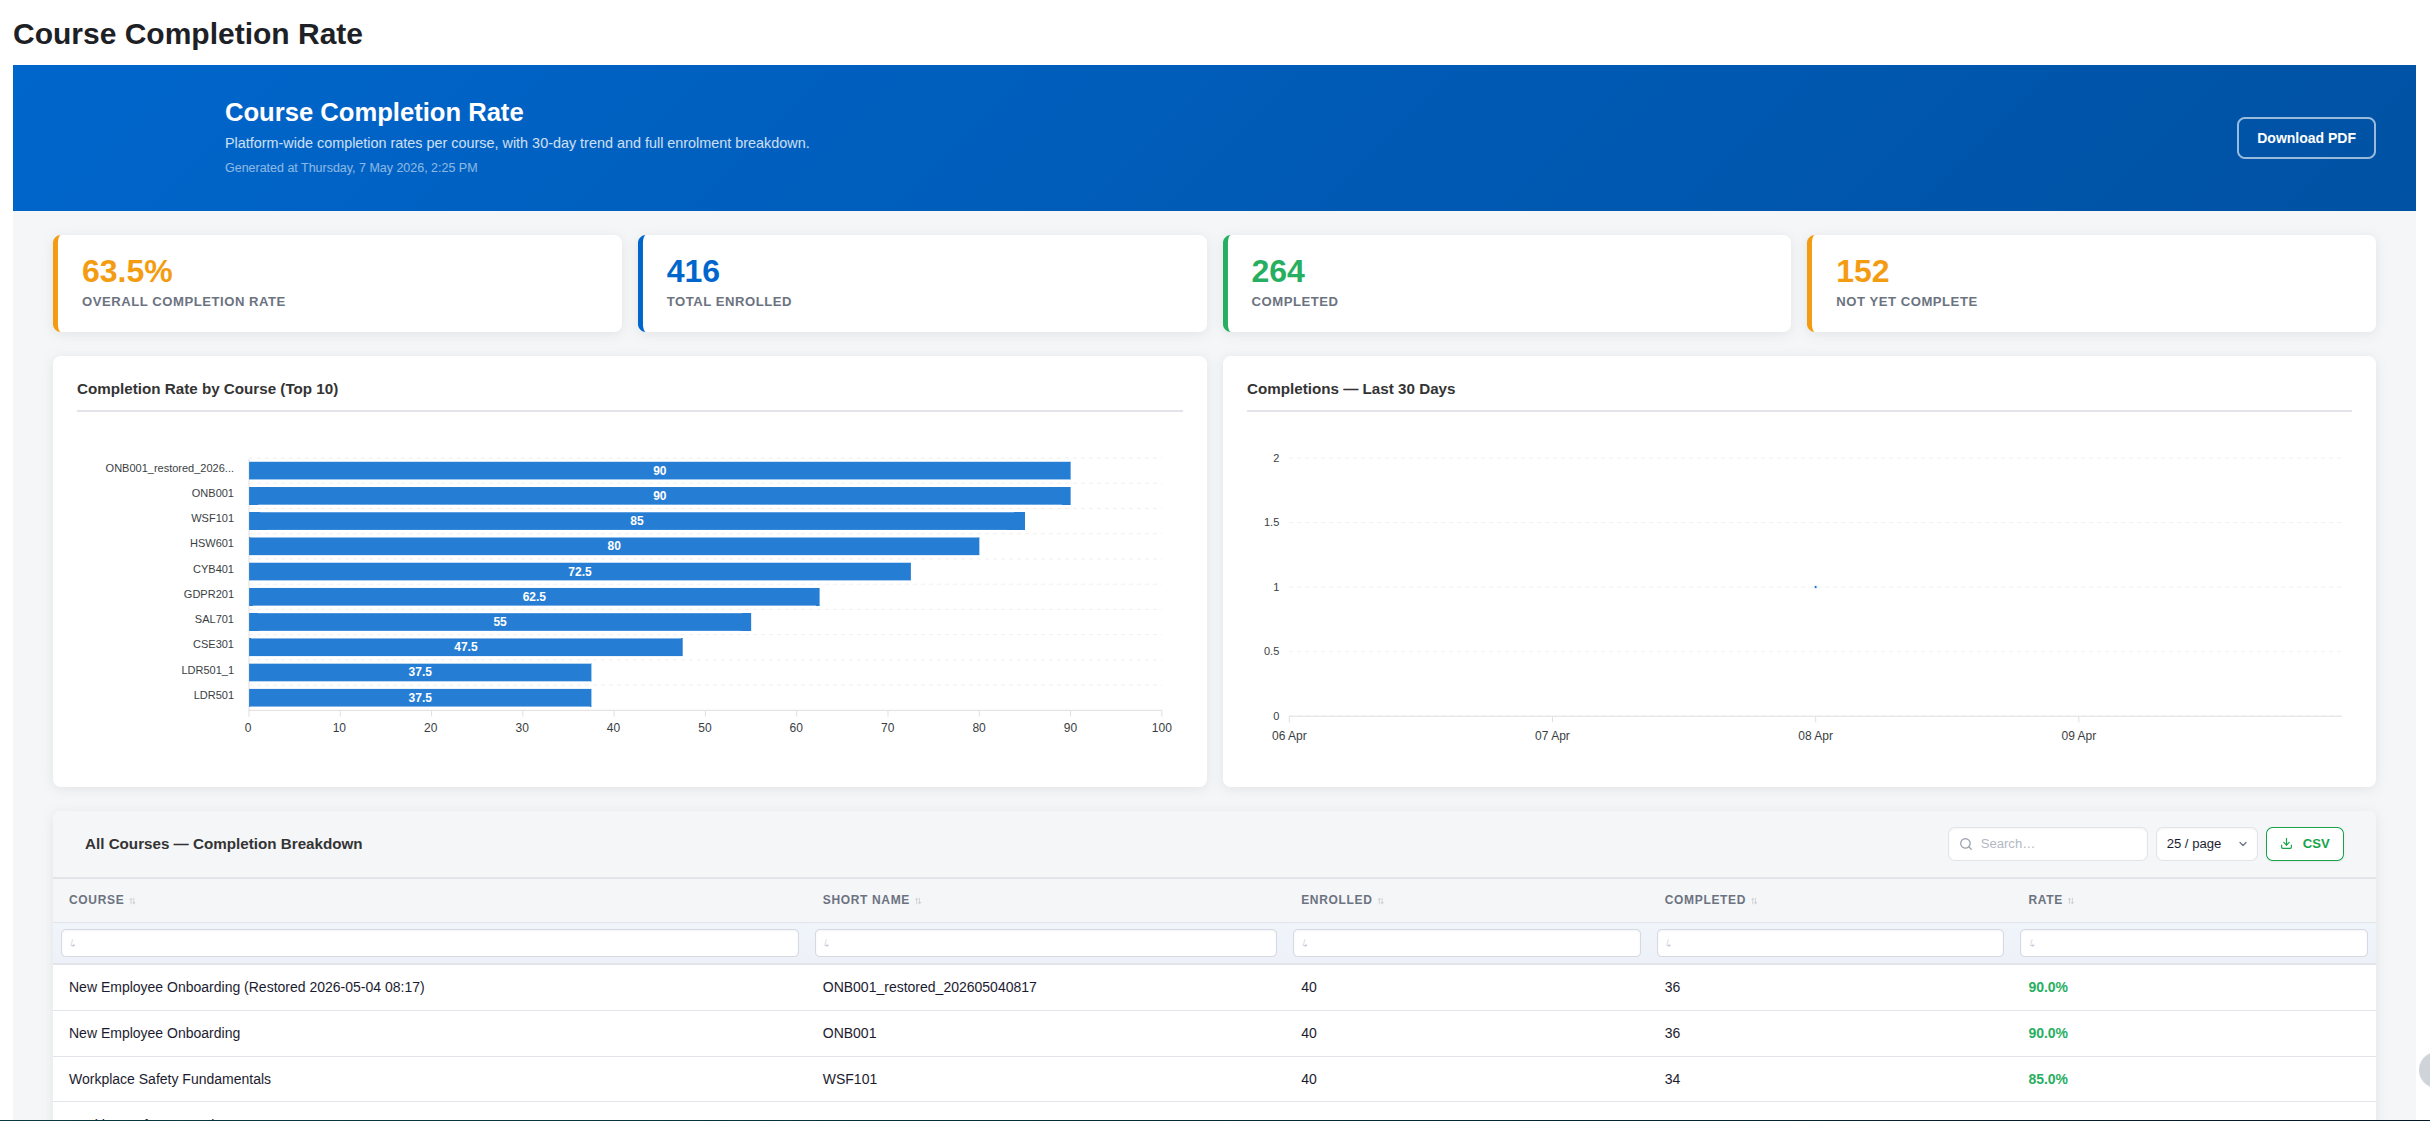
Open the Course Completion Rate report. It shows completion percentages per course alongside a 30-day trend. For a learner-level view of who has gone quiet, use the Silent Drop-Off Detector report.
Find learners who have stopped engaging
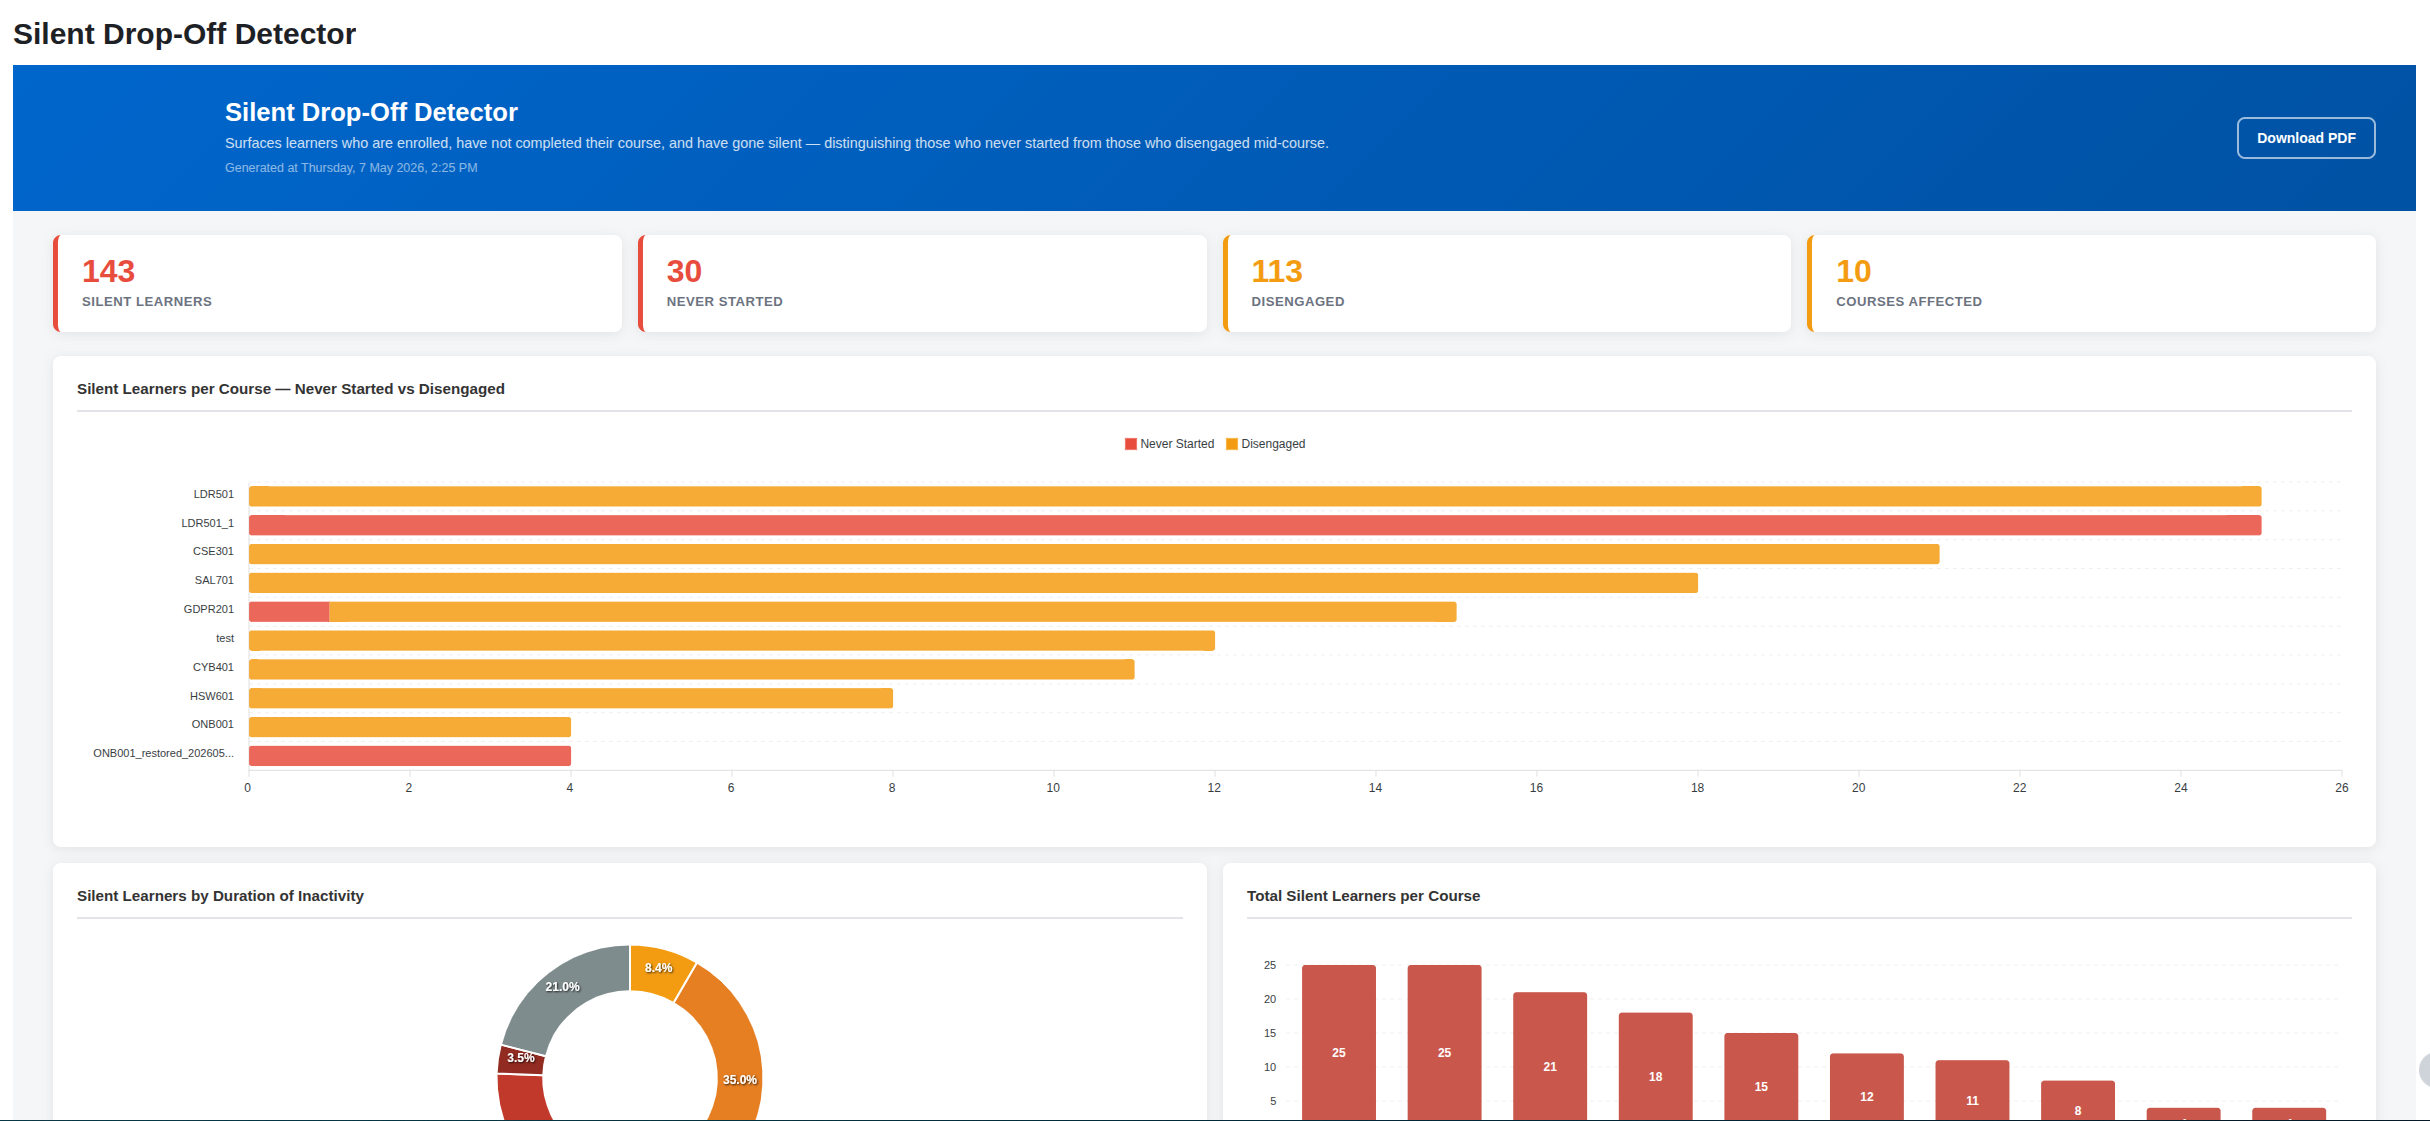
The Silent Drop-Off Detector identifies enrolled learners who have not completed a course and have shown no activity within the past 14 days. It separates learners who never started from those who were active but have since gone quiet.
See which parts of a course are causing problems
The Learning Friction report highlights individual course modules where learners are repeatedly returning, spending time but not finishing. High revisit counts and low completion rates on a specific activity are a sign that something is hard to understand or technically broken.
Check how much time learners actually spend on courses
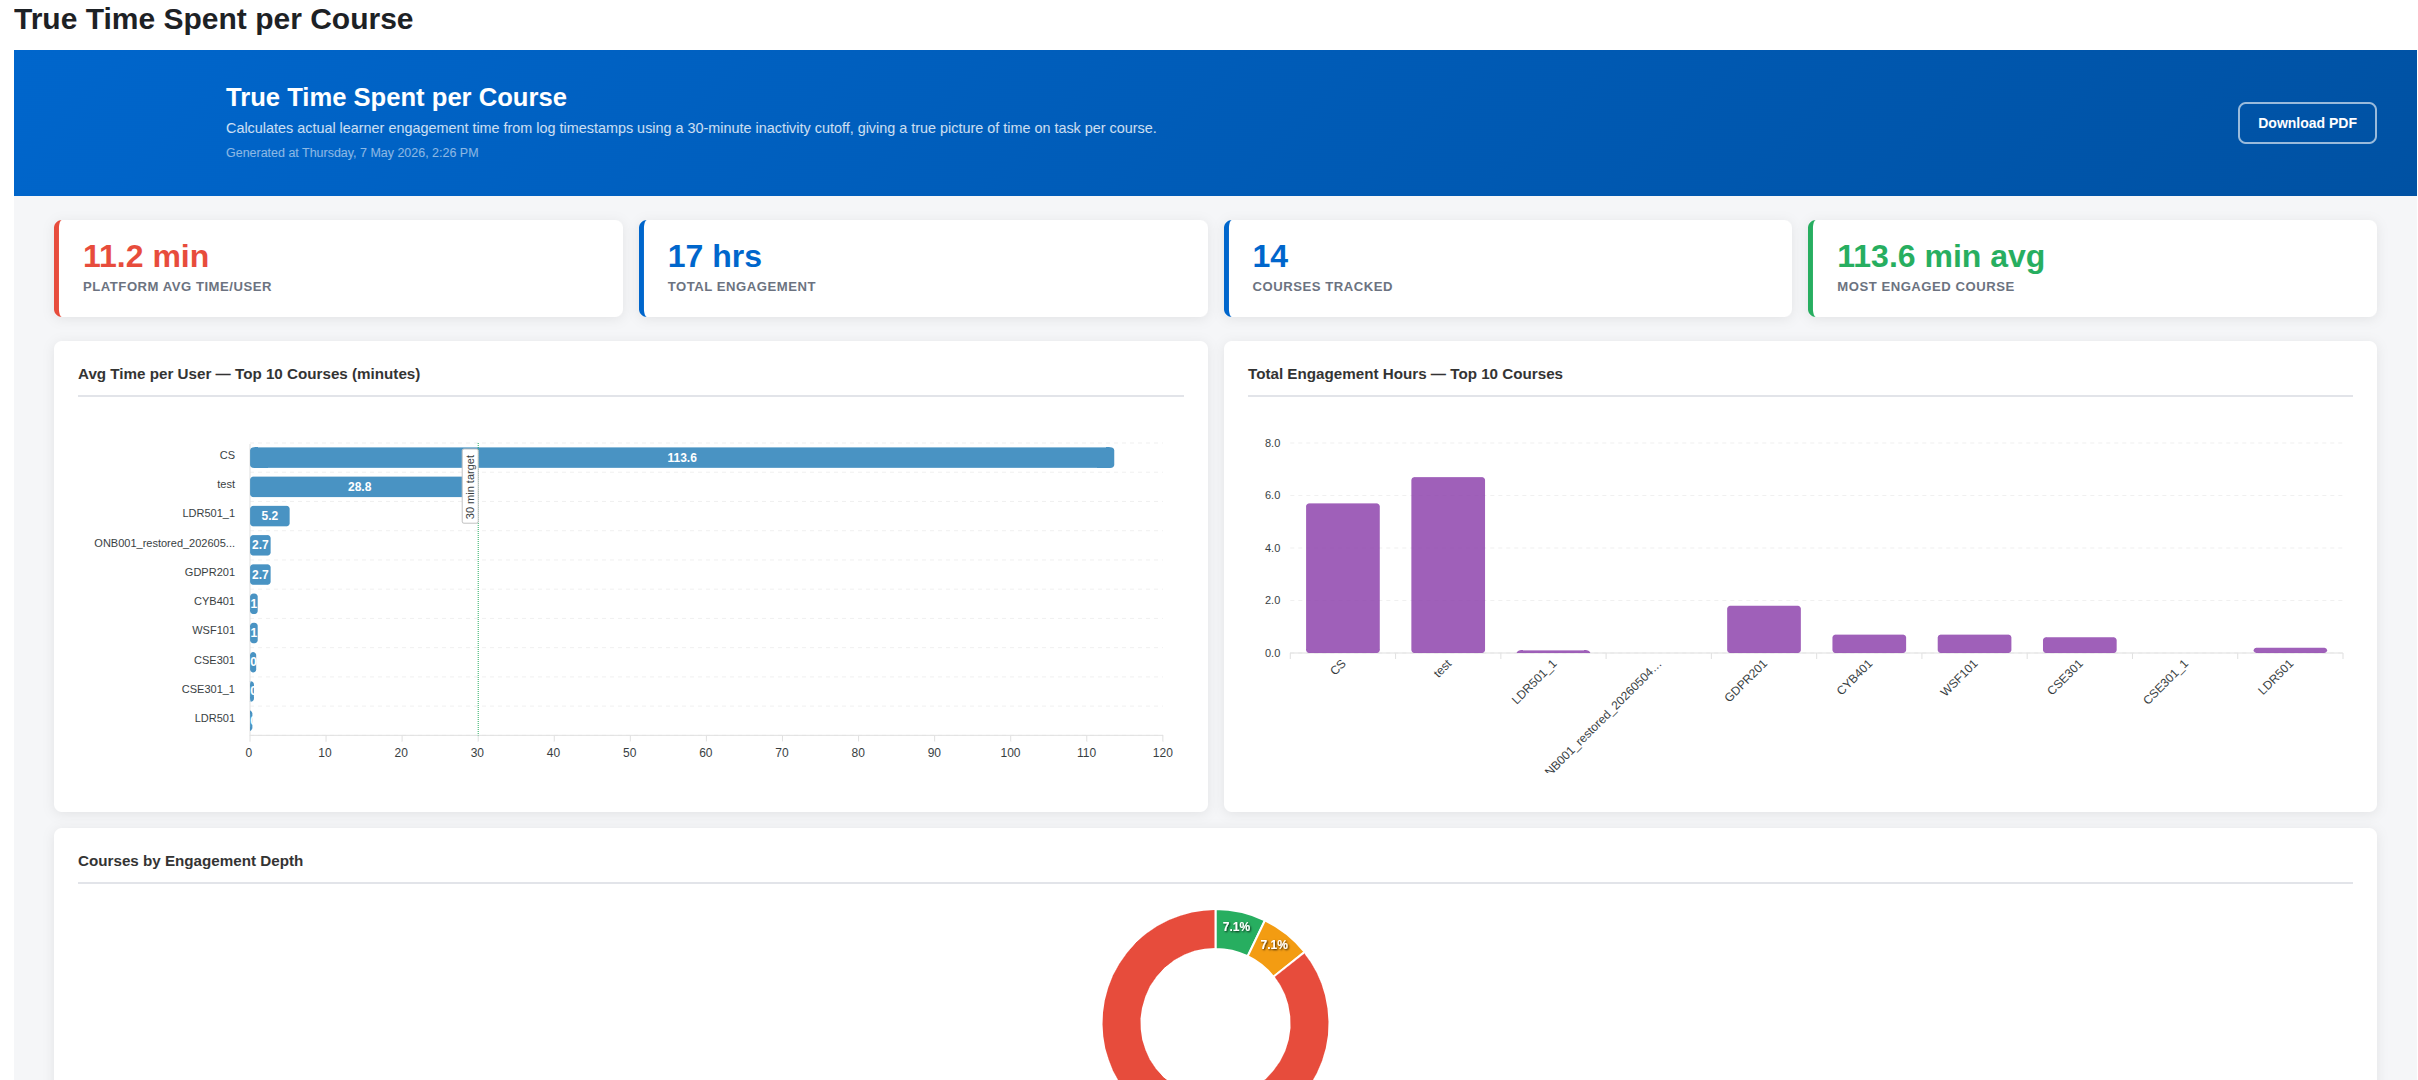
The True Time Spent per Course report calculates engagement time from activity logs. It uses a 30-minute inactivity cutoff to avoid counting idle browser windows, giving a more realistic picture of actual study time.
Identify inactive or lapsed user accounts
The Dormant Accounts report lists users who have not logged in for 30 or more days. From this report, managers can send a nudge email directly to prompt re-engagement.
Review quiz performance across the site
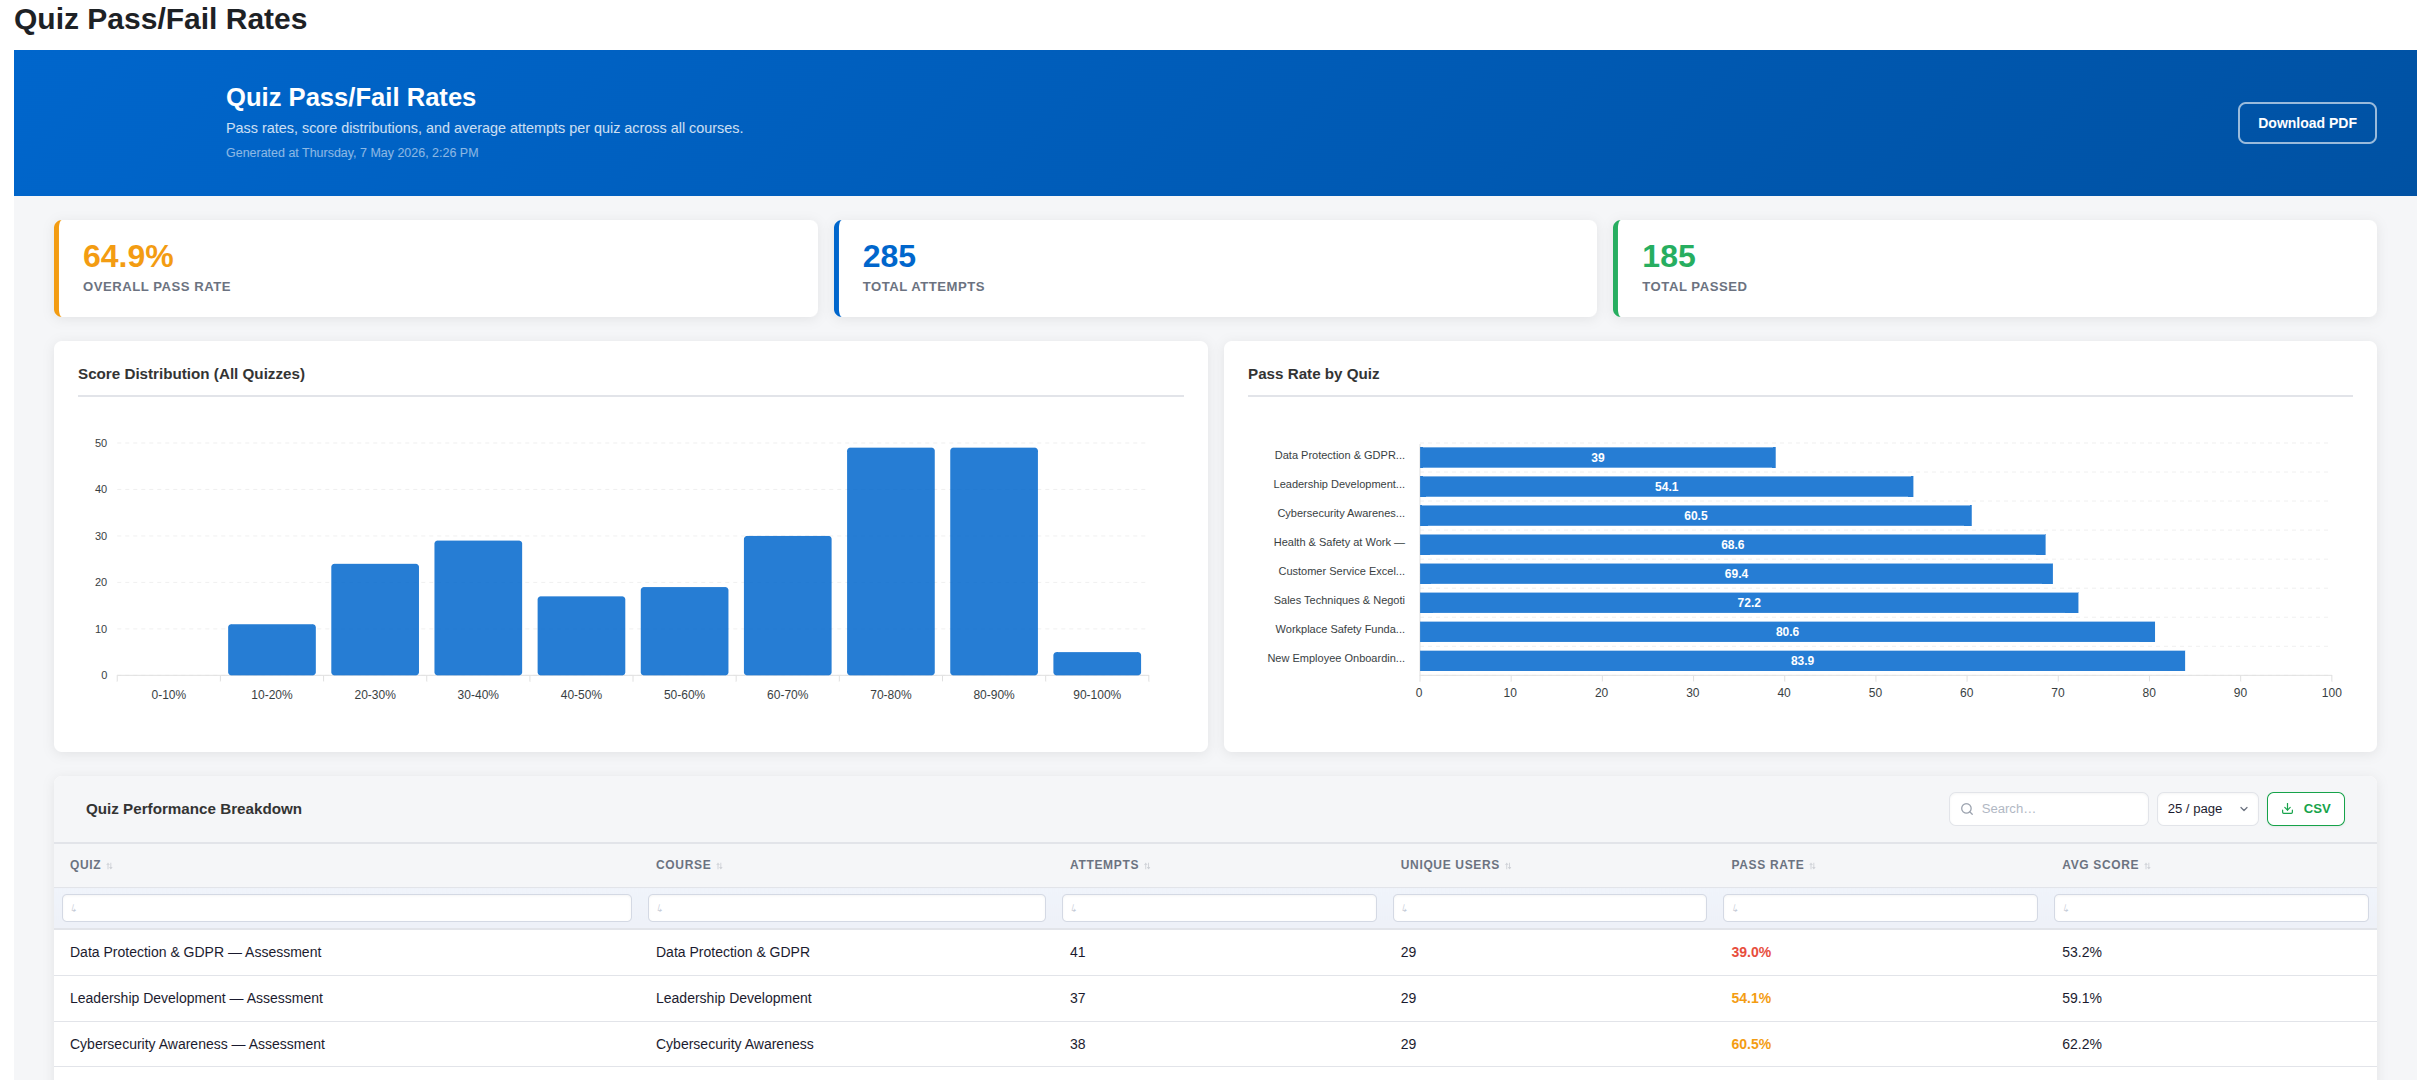
The Quiz Pass/Fail Rates report shows pass rates, score distributions, and average number of attempts across all quizzes and courses.
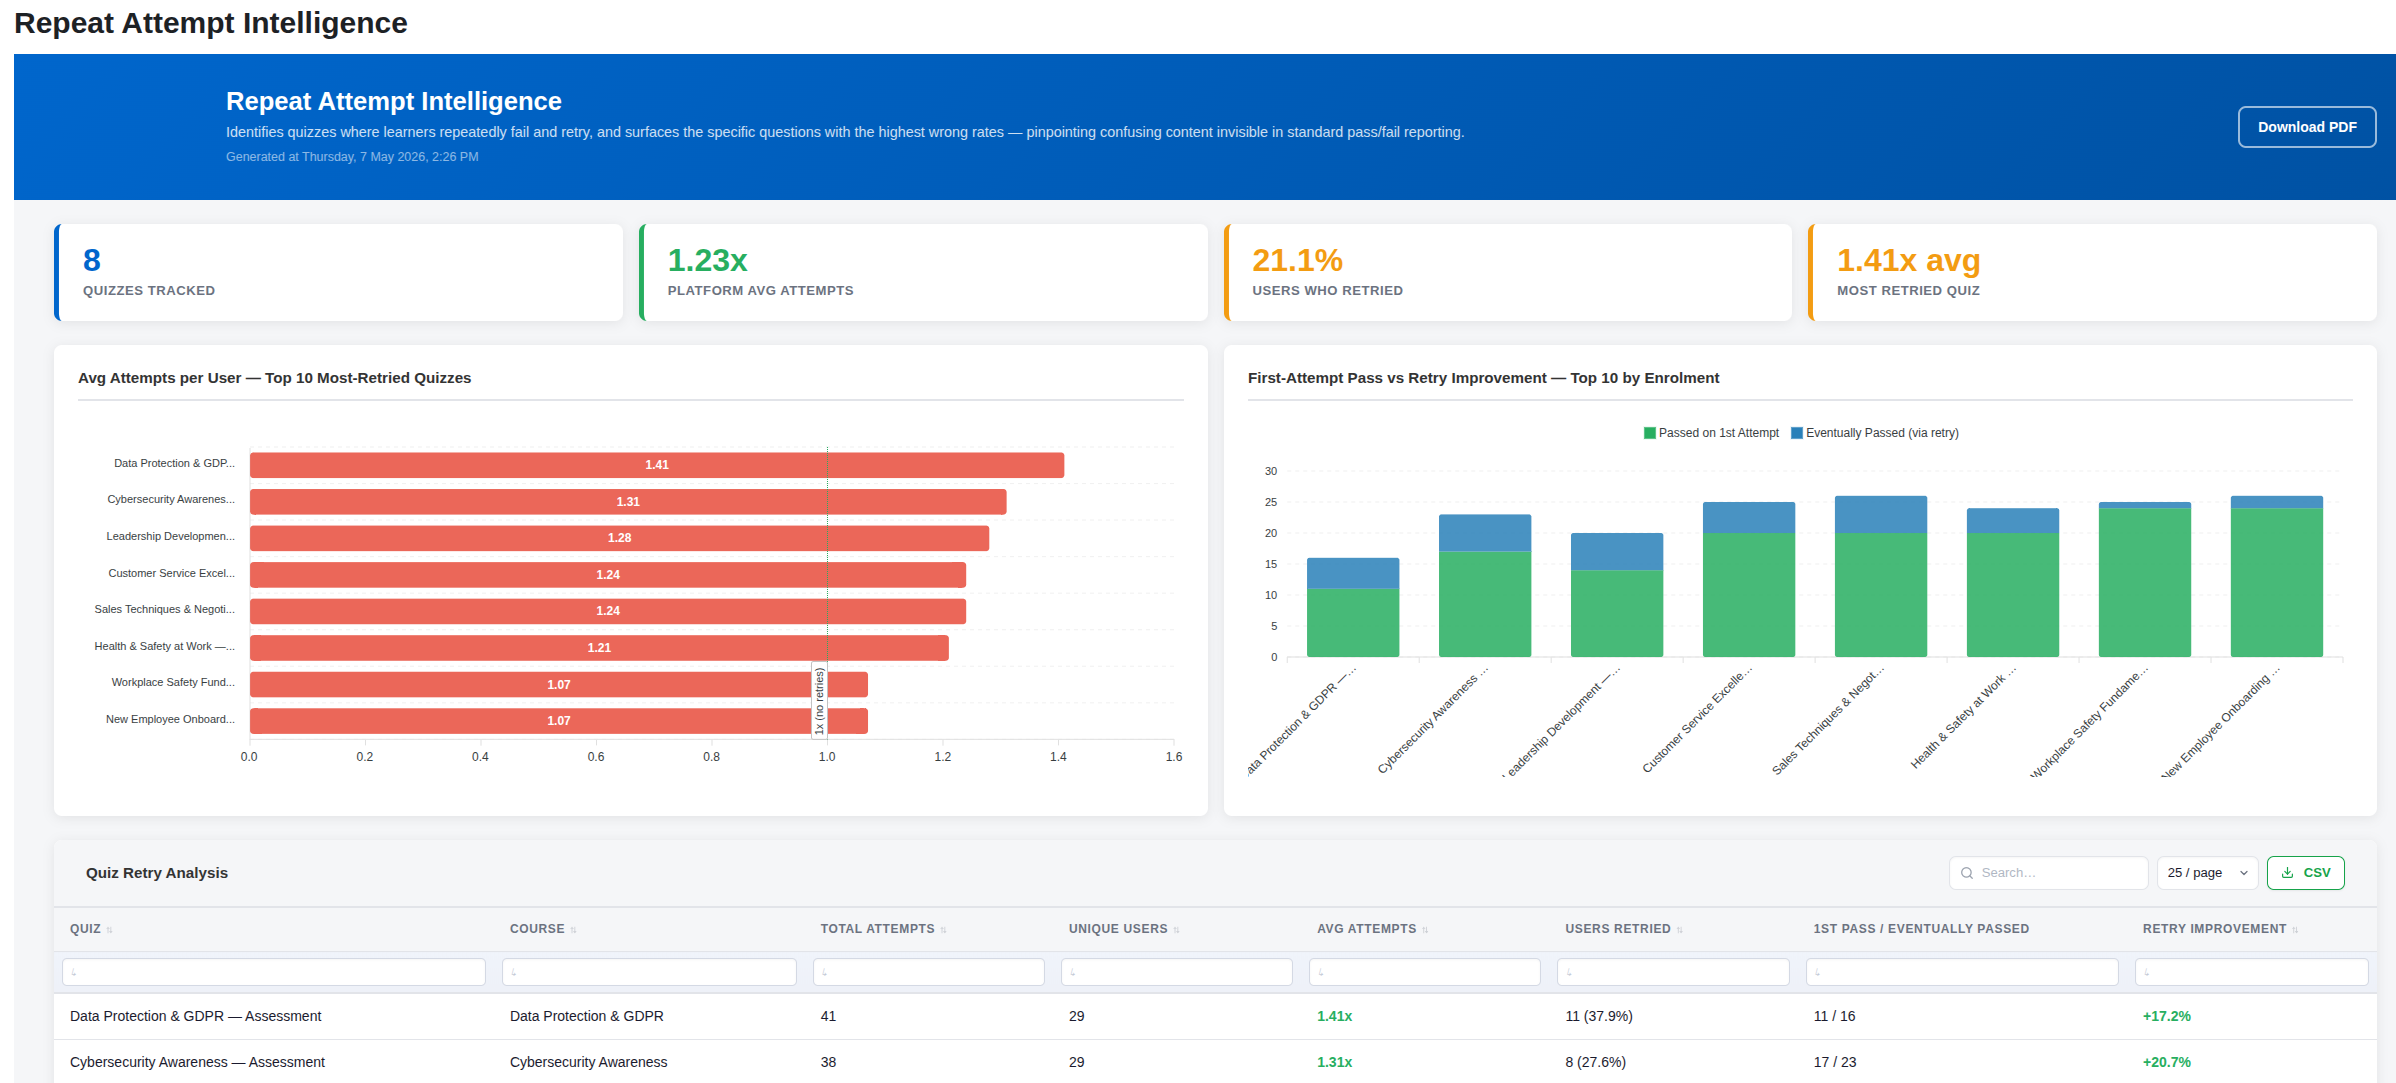
Find out which quizzes learners are retrying most
The Repeat Attempt Intelligence report goes beyond pass/fail to show which quizzes learners attempt multiple times and why. It groups quizzes by average attempts per user and shows how many learners eventually passed only after retrying. It also identifies the individual questions with the highest wrong rates across the site, which can point to confusing content or poor instructional design that standard reports miss.
Check enrolment trends over time
The Enrolment Over Time report shows monthly enrolment figures for the past 12 months, highlights the most popular courses, and flags learners who enrolled but never started.
Send a report to a colleague who does not use Moodle
Set up a schedule for the report and add the colleague's email address as a recipient. They will receive an email with a link that opens the full report in their browser no Moodle account needed. The link contains the data as it was at the time of sending, so they always see a consistent snapshot.
Review login activity across the platform
The Login Frequency report shows daily active users, weekly login trends over the past 12 weeks, and a breakdown of the most active user groups.
Analyse quiz completion speed versus outcomes
The Speed vs Success report plots how quickly learners completed a course against whether they passed. It groups learners into four categories: Efficient (fast and passing), Thorough (slow and passing), Guesser (fast but failing), and Struggling (slow and failing).
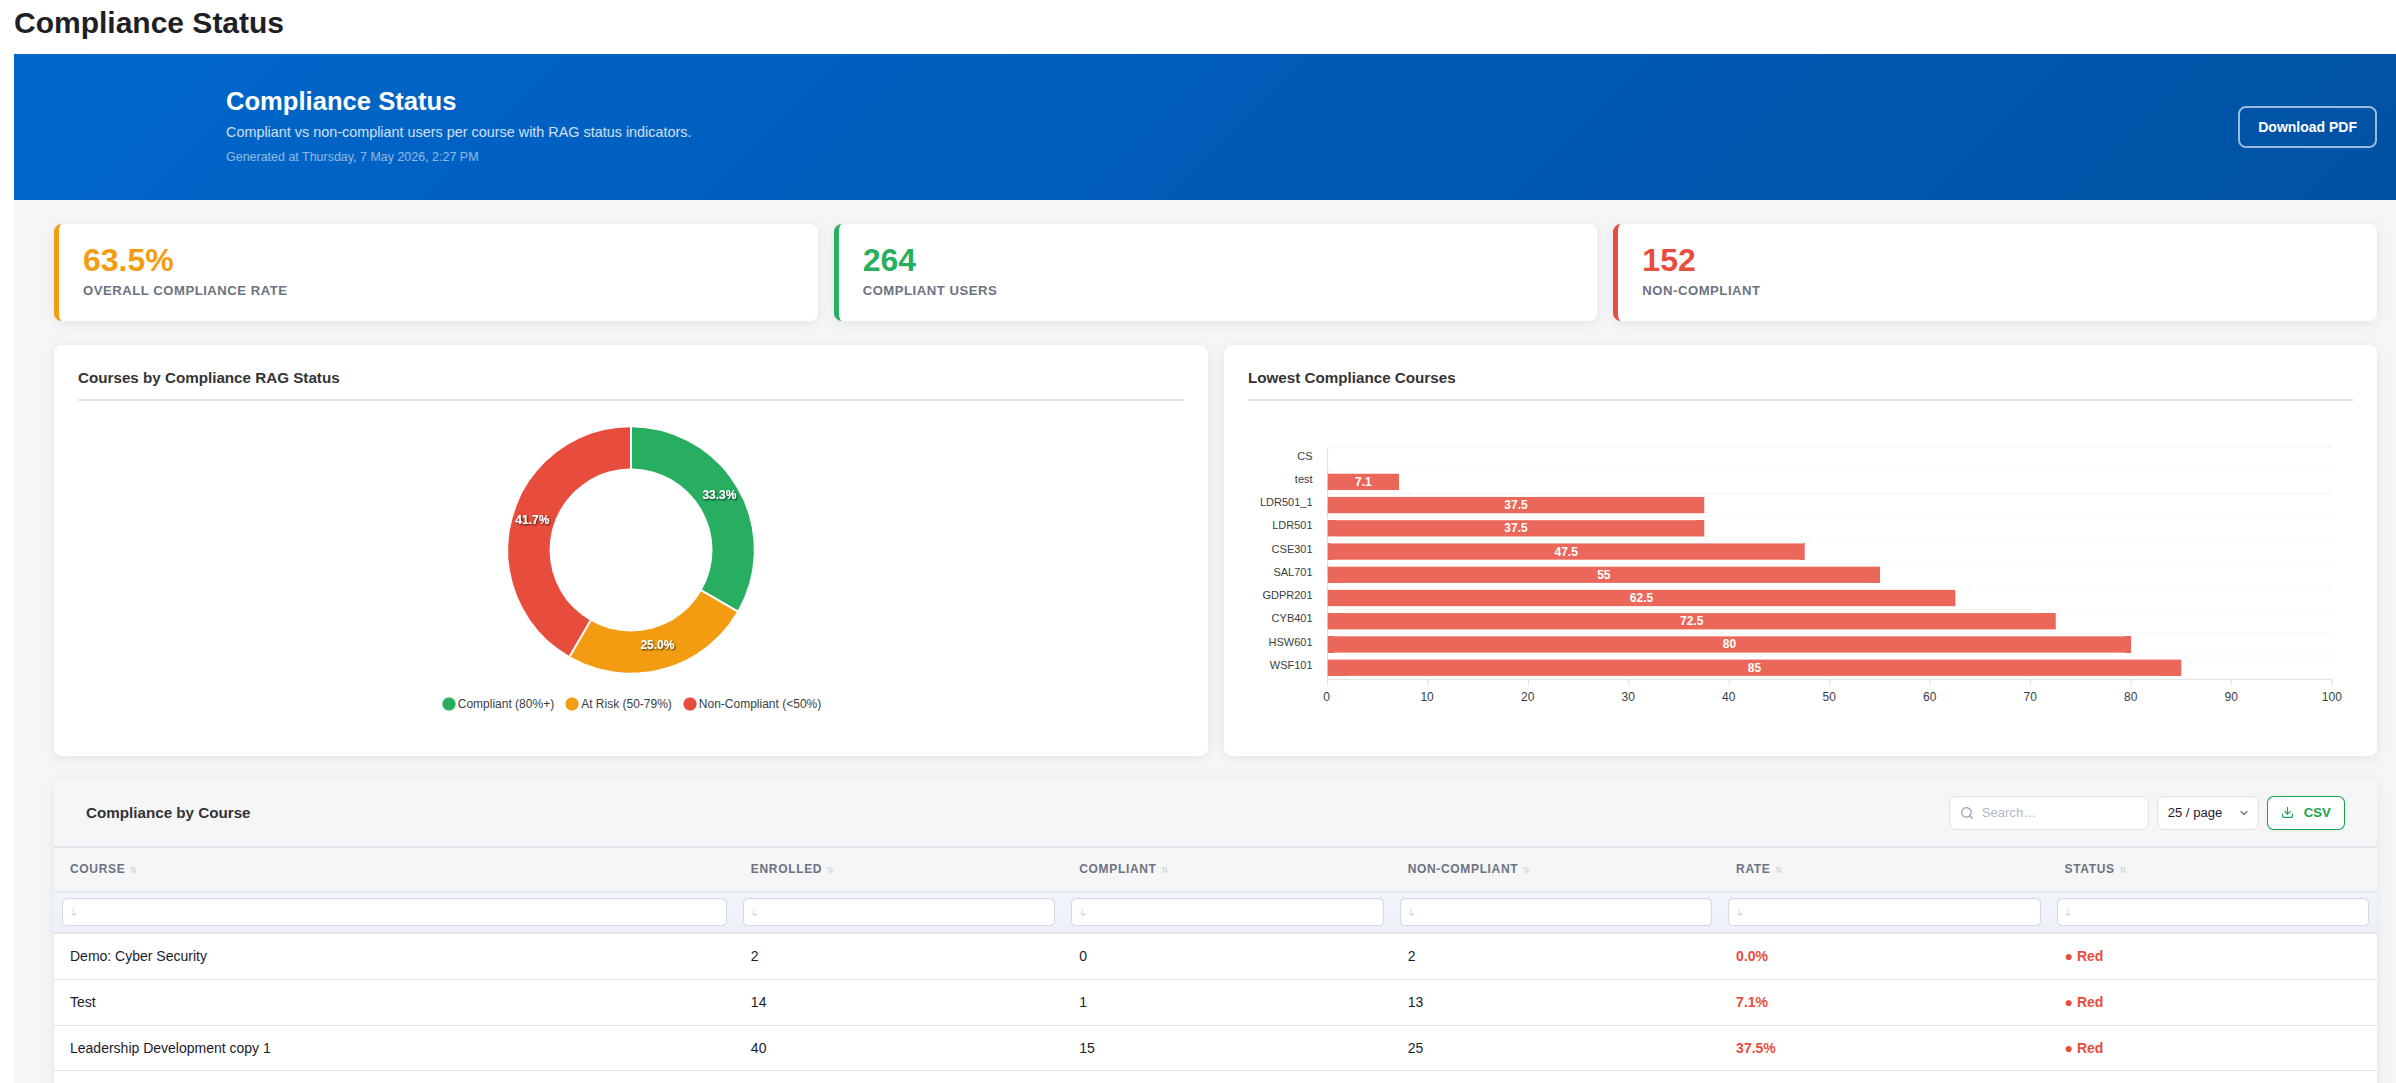
Check compliance status across the organisation
The Compliance Status report shows compliant versus non-compliant learners per course, with red, amber, and green status indicators. If the Compliance plugin is also installed, it connects to your compliance frameworks automatically.
Get a snapshot of all courses on the platform
The Course Overview report shows every course in your Moodle site how many learners are enrolled, whether the course is visible to learners, when it was last active, and how much file storage it is using. It also shows a 90-day enrolment trend so you can see whether activity is growing or declining across the catalogue.
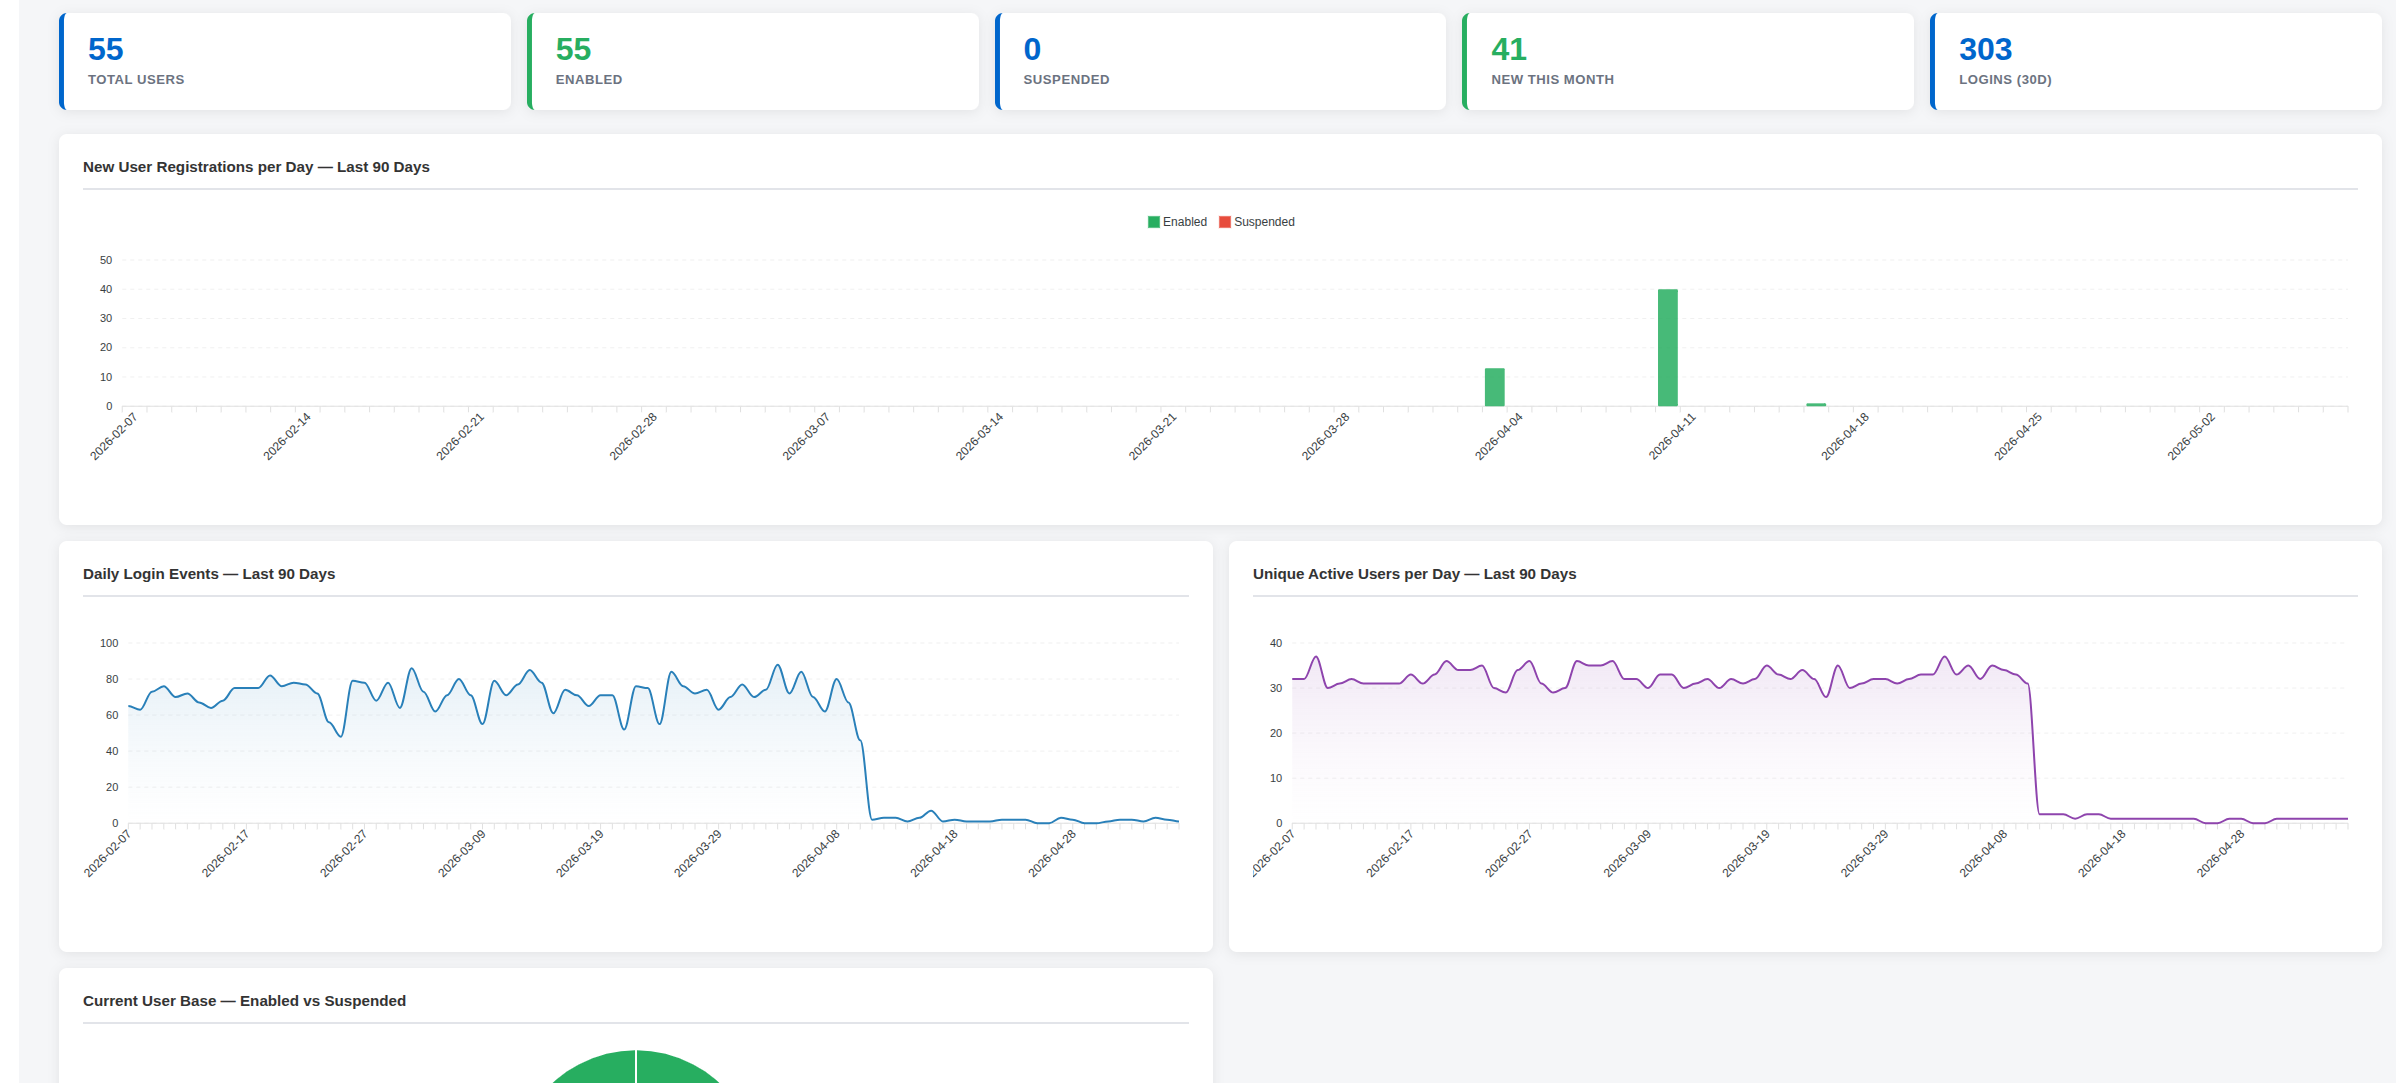
Check whether the platform is growing
The Platform Overview report answers the question "Is the platform being used?" at the highest level. It shows new user registrations per day over the past 90 days, daily login counts, unique active users, and the current split between enabled and suspended accounts.
Things to know
Reports are pre-computed, not live
All reports are calculated in the background on a schedule and stored so they open instantly. This means data is not real-time it reflects the most recent computation, which runs hourly by default. On a large site, this is intentional: running heavy queries live for every page view would slow things down for everyone.
Email links show a data snapshot by default
When a scheduled email is sent, the view link contains a snapshot of the report data from the moment it was sent. If the report data refreshes later, the recipient's link still shows the original snapshot. This ensures consistent data for each delivery. Administrators can change this per schedule to show the latest cached data instead.
Download PDF uses the browser print function
Clicking Download PDF opens your browser's built-in print dialog. Choose Save as PDF as the destination. No separate PDF software is required.
Database version affects some reports
The True Time Spent per Course and Repeat Attempt Intelligence reports require MySQL 8.0 or higher, MariaDB 10.2 or higher, or PostgreSQL. These reports use a database feature (window functions) not available in older versions. On older database versions these reports will not display data. All other reports work on any supported Moodle database version.
The Speed vs Success report requires grade data
This report only includes learners where a final course grade has been recorded in Moodle. If final grades are not being populated in the gradebook, those completions will not appear in the chart.
The Compliance Status report works without the Compliance plugin
If the optional Compliance plugin is not installed, the Compliance Status report falls back to course completion data and does not produce an error. Installing the Compliance plugin later adds richer data automatically.
The Repeat Attempt Intelligence report requires sufficient quiz activity
Individual questions only appear in the problem-question table once they have at least three recorded responses. Brand new quizzes with few attempts will not show question-level data until more learners have completed them.
Course and Platform Overview reports show 90 days of trend data
The daily trend charts in the Course Overview and Platform Overview reports cover the past 90 days. Every calendar day in that range is shown, so days with no activity appear as zero rather than being skipped.
Access is controlled by role and capability
By default, Managers and Course Creators can view reports. Only Managers can create schedules, manage recipients, and access settings. Site administrators have full access to everything. Access can be adjusted through Moodle's role permissions.
External link viewers see a read-only report
People who access a report via a secure email link see the full report charts, tables, and summary but cannot take any actions such as sending nudge emails. Those actions require a Moodle login with appropriate permissions.
Troubleshooting
A report shows "No data"
- Check that Moodle's standard logstore is enabled: Site administration → Plugins → Logging → Manage log stores.
- Ask your administrator to run the compute task manually, or wait for the next scheduled run (hourly).
- Some reports require activity to have occurred a brand new Moodle site with no logins or completions will show empty data.
Charts appear blank
This is usually a browser loading issue. Try refreshing the page. If charts remain blank, check the browser console for errors and contact your administrator. It can also happen if JavaScript is disabled in your browser.
A scheduled email was not received
- Check your spam or junk folder.
- Confirm that at least one recipient has been added to the schedule.
- Ask your administrator to verify that Moodle's outgoing mail is configured correctly.
- Ask your administrator to check that the Moodle cron is running.
A secure view link shows a "403 Forbidden" or "link expired" error
The link has expired or been revoked. Ask the person who set up the schedule to send you a fresh copy, or to adjust the expiry settings for future deliveries.
The Time Spent, Repeat Attempt Intelligence, or Speed vs Success report shows no data
For True Time Spent per Course and Repeat Attempt Intelligence, your database may not support the required feature ask your administrator to check the database version. For Speed vs Success, check that final grades are populated in the Moodle gradebook for the courses you expect to see.
A schedule is set up but emails are not going out
Confirm the schedule is marked as Active in the schedule list. Also confirm that at least one recipient has been added. Inactive schedules and schedules with no recipients will not send.
The Course Overview or Platform Overview shows no storage or no user data
Storage figures are calculated from the Moodle files table and appear once the compute task has run. On a new installation, run the task manually from Site administration → Server → Scheduled tasks. User counts will be zero if there are no accounts other than the site administrator.
Frequently asked questions
Do external recipients need a Moodle account?
No. Anyone who receives a scheduled report email can click the link and view the full report in their browser without logging in to Moodle. The link is secure and time-limited according to the expiry setting you choose.
How current is the data in the reports?
Reports are refreshed automatically in the background, by default every hour. The data you see is from the last time the report was computed. For most reporting purposes this is current enough, and it means reports always open instantly with no delay.
Can I get a report in a format I can open in Excel?
Not directly. Reports are designed for on-screen viewing and browser-print PDF. If you need raw data for spreadsheet analysis, your administrator may be able to export data directly from Moodle's database.
Can I choose which courses or users appear in a report?
Reports are site-wide by default. Some reports may offer basic filters. If you need a report scoped to a specific course or category, speak to your administrator about the available options.
Can I schedule the same report to go to different people at different times?
Yes. You can create multiple schedules for the same report, each with a different frequency, time, and recipient list.
What happens to the email link when the next scheduled send runs?
This depends on the expiry setting. If set to Expires when next delivery runs, the previous link stops working as soon as the next email is sent. Other settings let the link remain active for a set number of days, indefinitely, or until manually revoked.
Is the data in the emailed report the same as what I see in the library?
The emailed link shows a snapshot of the data from the moment the email was sent. The live report library shows the most recently computed data. These may differ if the report has refreshed since the email was sent. This can be changed per schedule if you always want recipients to see the latest data.
Who can change the report branding?
Only administrators can change branding settings. The settings are at Site administration → EssingtonITS → Report Viewer - Settings.
How do I stop a scheduled report from sending?
Go to Site administration → EssingtonITS → Report Viewer - Manage Schedules, find the schedule, and toggle it to Inactive. The schedule is preserved so you can reactivate it later.
What does the Repeat Attempt Intelligence report tell me that Quiz Pass/Fail Rates does not?
Quiz Pass/Fail Rates tells you whether learners pass. Repeat Attempt Intelligence tells you how many tries it took and which specific questions they kept getting wrong. If a quiz has a high retry rate and one question has a 70% wrong rate, that question is probably worth reviewing it may be confusing, ambiguous, or poorly worded.
What is the difference between Course Overview and Platform Overview?
Course Overview focuses on your course catalogue enrolments, activity, and storage per course. Platform Overview focuses on your user base how many accounts exist, how many new registrations are happening, and how many people are logging in each day. Together they give a complete picture of platform health.
Will more reports be added in future?
Yes. The report library is designed to grow over time. New reports are added with each plugin update and become available automatically once you update.
Summary
Report Viewer gives Moodle administrators and managers a clear, consistent view of learner activity, completions, compliance, engagement, quiz intelligence, and platform-wide growth without the need for custom queries or data exports. Reports open instantly, look professional, and can be shared automatically with anyone who needs them, inside or outside your organisation. Branding, scheduling, and access control are all managed centrally through Site Administration.
Additional reports also available.
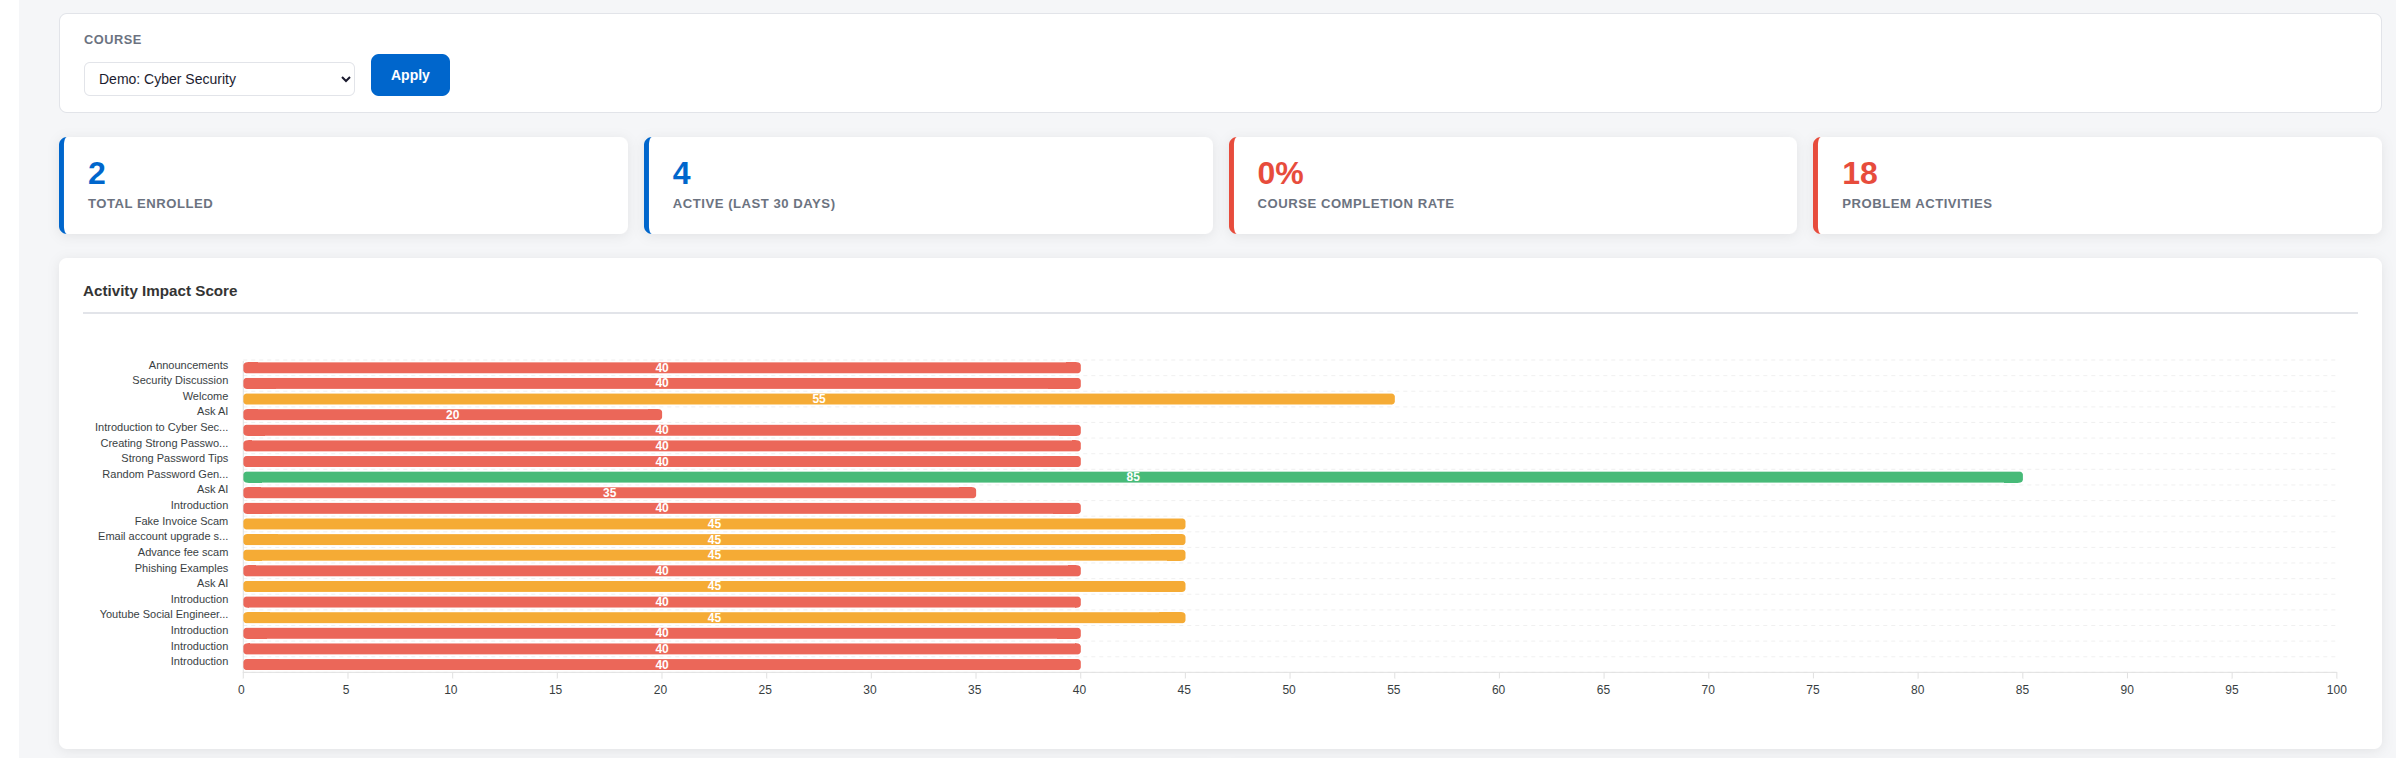
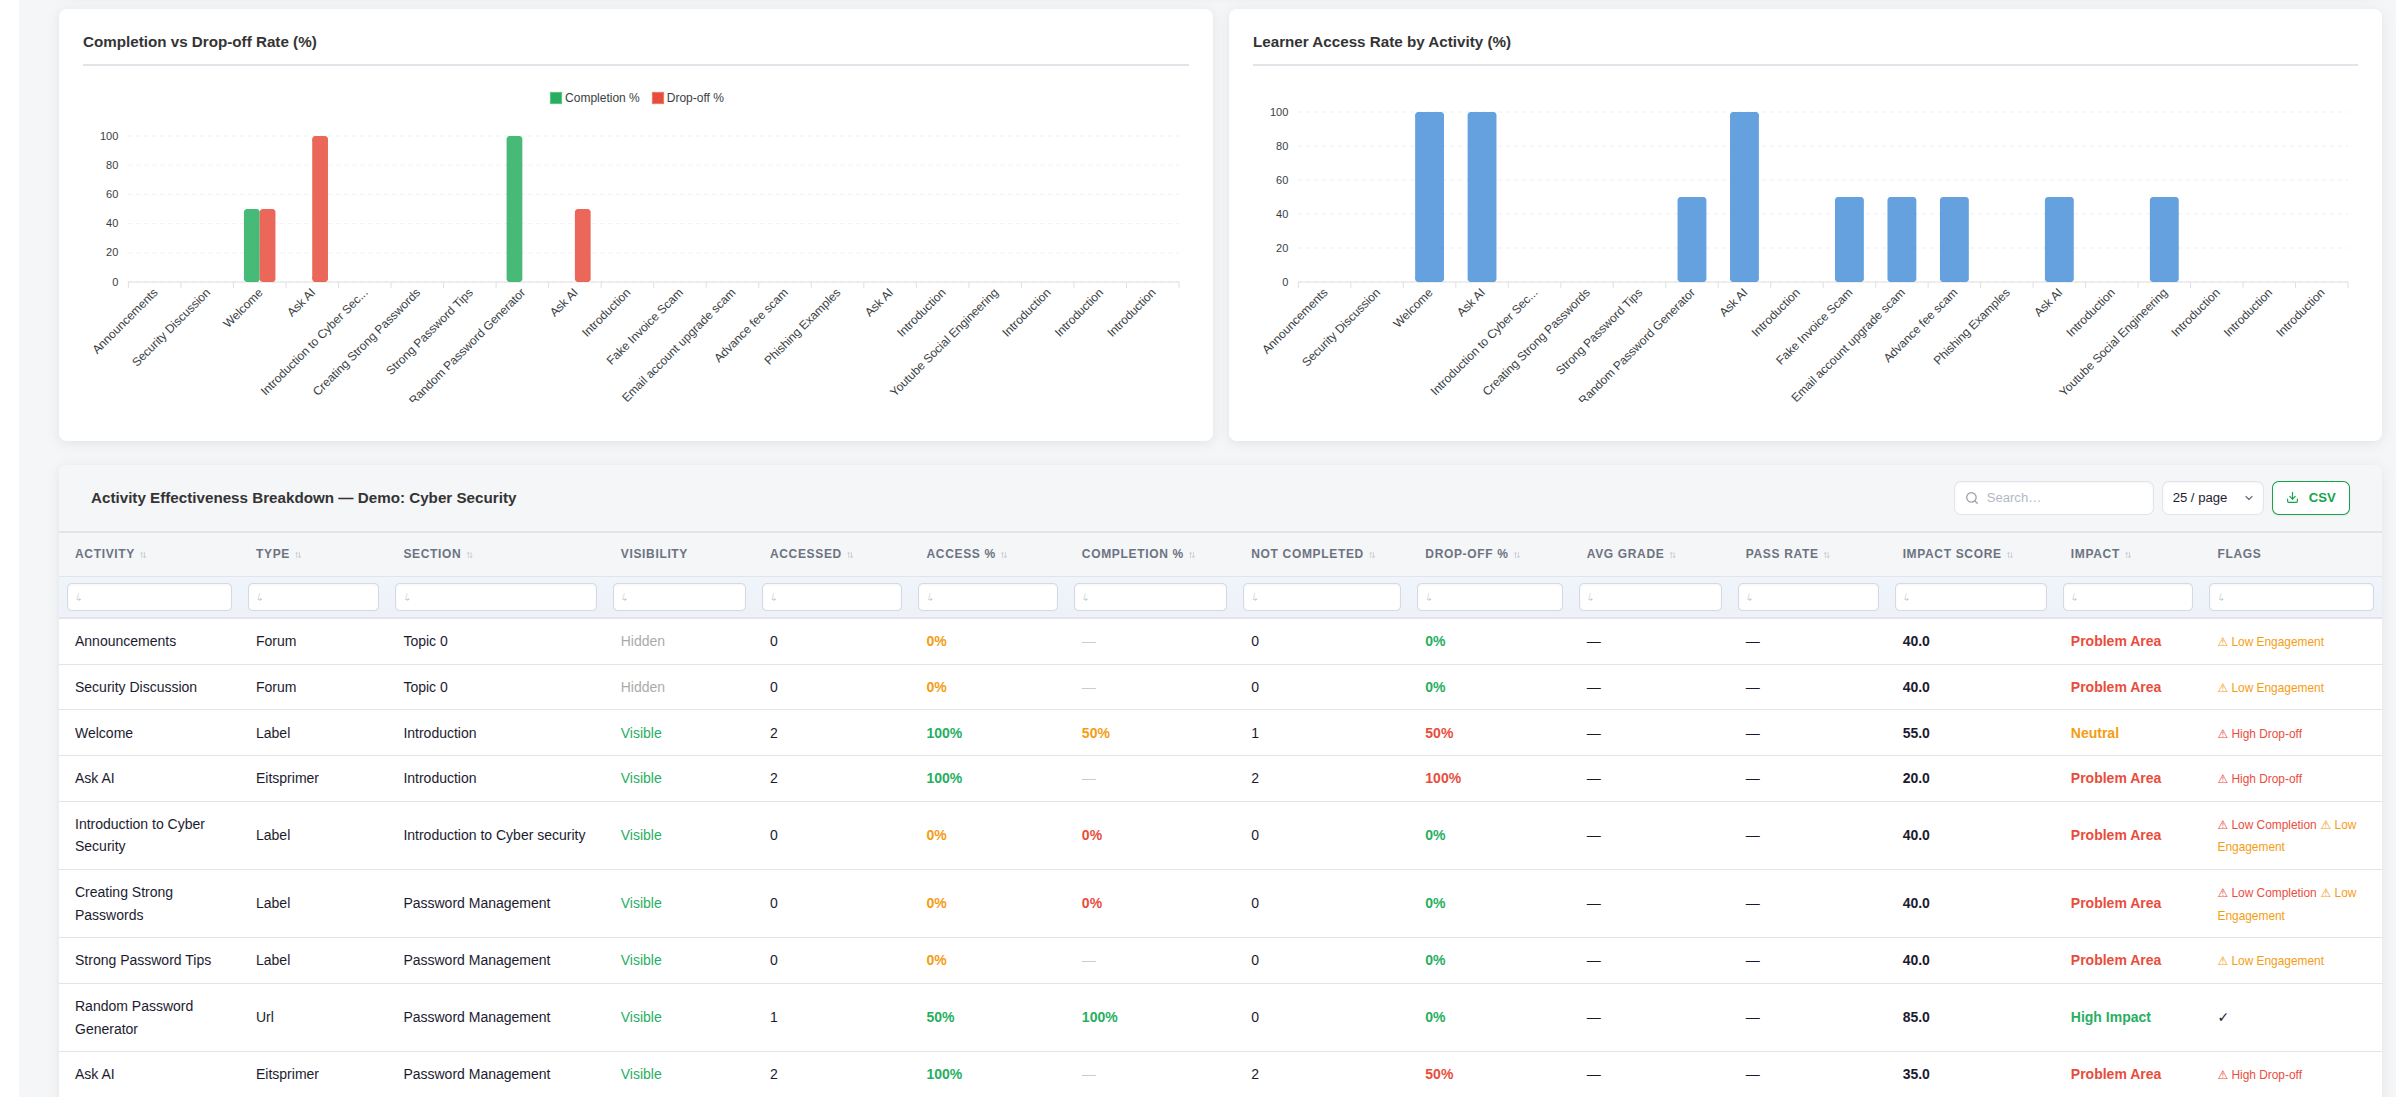
Course Effectiveness Drill-Down
Identifies exactly where learners disengage within a course and quantifies the effectiveness of each activity using engagement, completion, drop-off, and performance data.
Looking to optimise your Learning Management System? EssingtonITS offers tailored solutions to enhance your e-learning environment. Visit EssingtonITS.co.uk for expert IT services, or explore our dedicated hosting and support for Moodle at myelms.co.uk. Let us help you create a seamless and efficient learning experience.
person people found this useful.